Answered step by step
Verified Expert Solution
Link Copied!

Question

1 Approved Answer

Problem 2 (4 pts). The plot below shows the training and validation r-squared scores of a ridge regression model for varying values of the rgularization
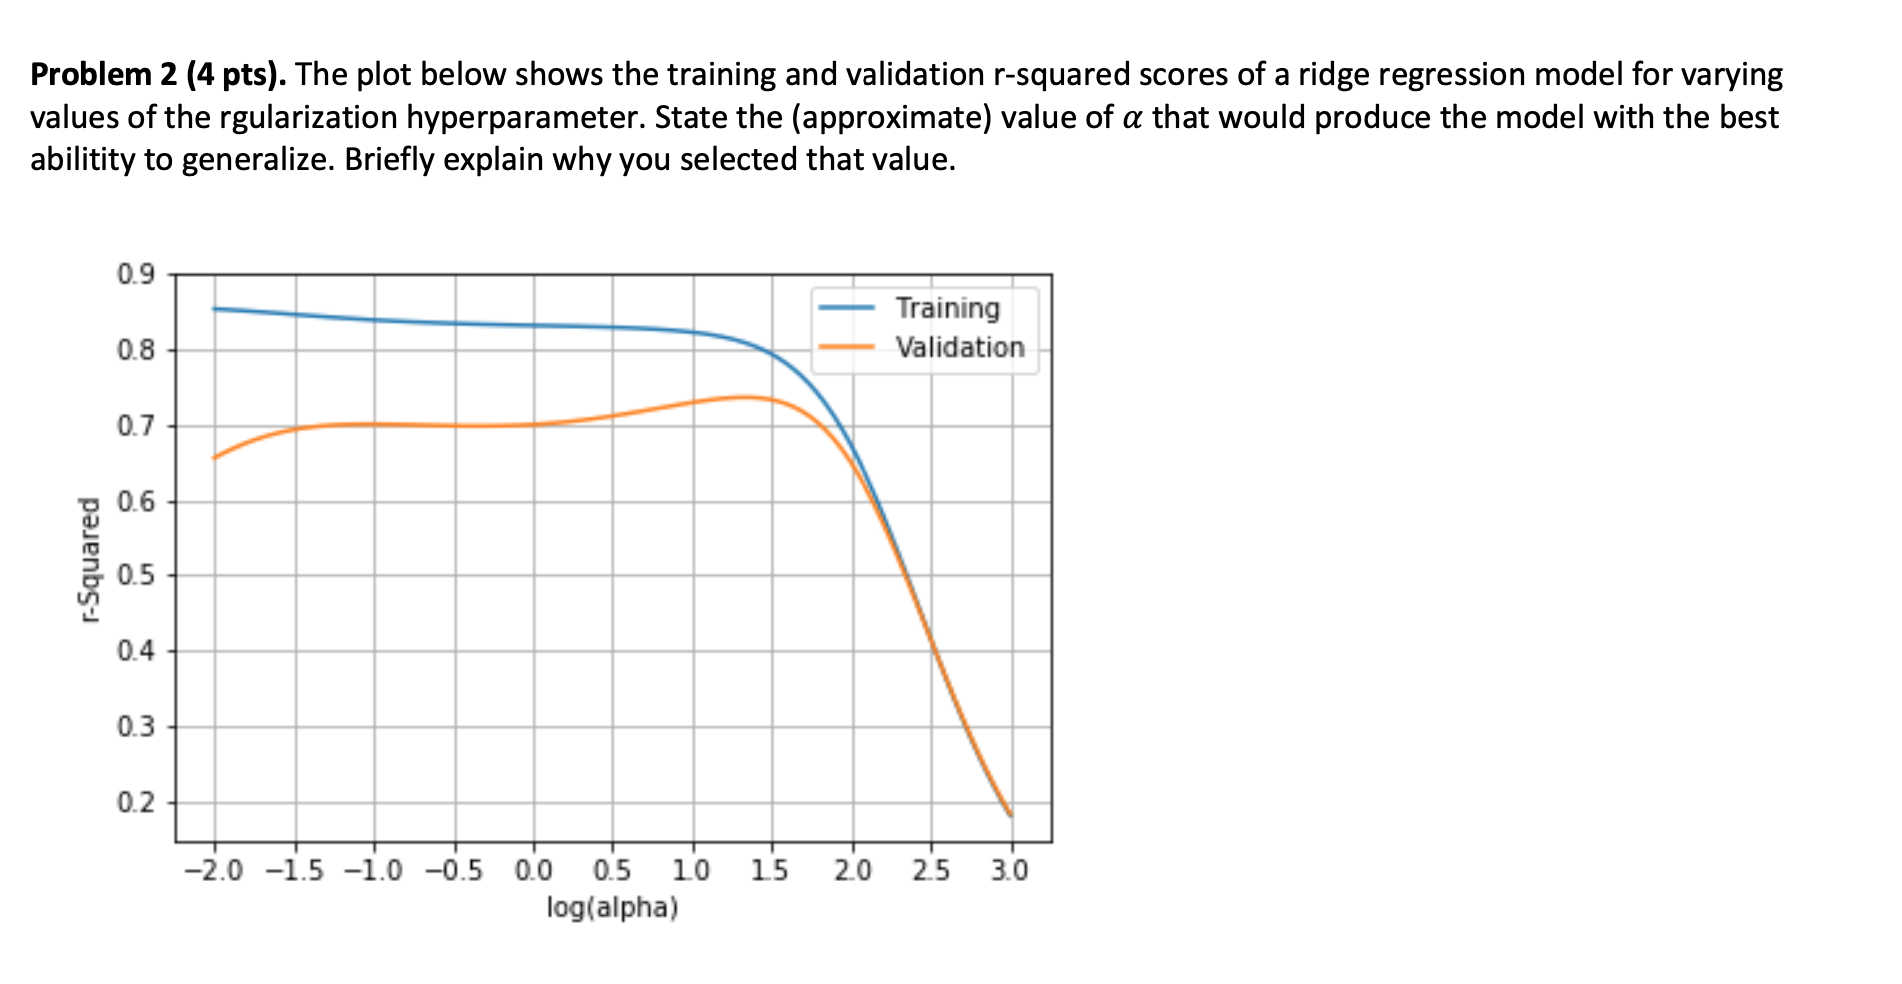
image text in transcribed

Problem 2 (4 pts). The plot below shows the training and validation r-squared scores of a ridge regression model for varying values of the rgularization hyperparameter. State the (approximate) value of a that would produce the model with the best abilitity to generalize. Briefly explain why you selected that value. 0.9 Training Validation 0.8 0.7 0.6 -Squared 0.5 0.4 0.3 0.2 15 2.0 2.5 3.0 -2.0 -1.5 -1.0 -0.5 0.0 0.5 10 log(alpha) Problem 2 (4 pts). The plot below shows the training and validation r-squared scores of a ridge regression model for varying values of the rgularization hyperparameter. State the (approximate) value of a that would produce the model with the best abilitity to generalize. Briefly explain why you selected that value. 0.9 Training Validation 0.8 0.7 0.6 -Squared 0.5 0.4 0.3 0.2 15 2.0 2.5 3.0 -2.0 -1.5 -1.0 -0.5 0.0 0.5 10 log(alpha)

Step by Step Solution

There are 3 Steps involved in it

Step: 1

blur-text-image

Get Instant Access to Expert-Tailored Solutions

See step-by-step solutions with expert insights and AI powered tools for academic success

Step: 2

blur-text-image

Step: 3

blur-text-image

Ace Your Homework with AI

Get the answers you need in no time with our AI-driven, step-by-step assistance

Get Started

Recommended Textbook for

Hands On Database

Authors: Steve Conger

1st Edition

013610827X, 978-0136108276

More Books

Students also viewed these Databases questions

Question

5. Discuss the key roles for training professionals.

Answered: 1 week ago