

Answered step by step
Verified Expert Solution
Question
1 Approved Answer
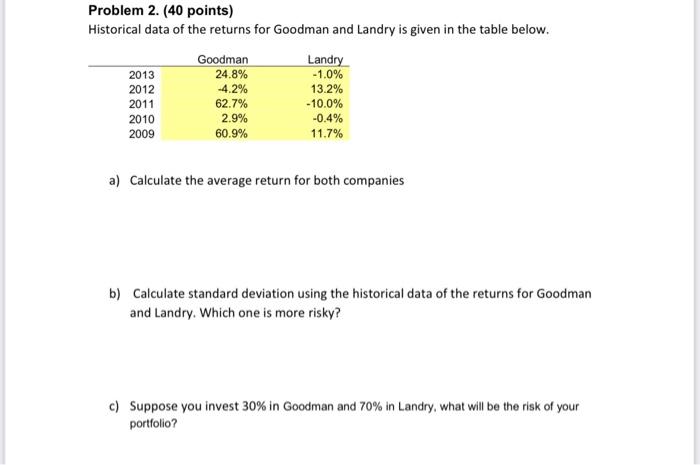
Problem 2. (40 points) Historical data of the returns for Goodman and Landry is given in the table below. 2013 2012 2011 2010 2009 Goodman
Step by Step Solution
There are 3 Steps involved in it
Step: 1

Get Instant Access to Expert-Tailored Solutions
See step-by-step solutions with expert insights and AI powered tools for academic success
Step: 2

Step: 3
Ace Your Homework with AI
Get the answers you need in no time with our AI-driven, step-by-step assistance
Get Started
Foundations Of Financial Management
Authors: Stanley Block, Geoffrey Hirt, Bartley Danielsen
17th Edition
126001391X, 978-1260013917