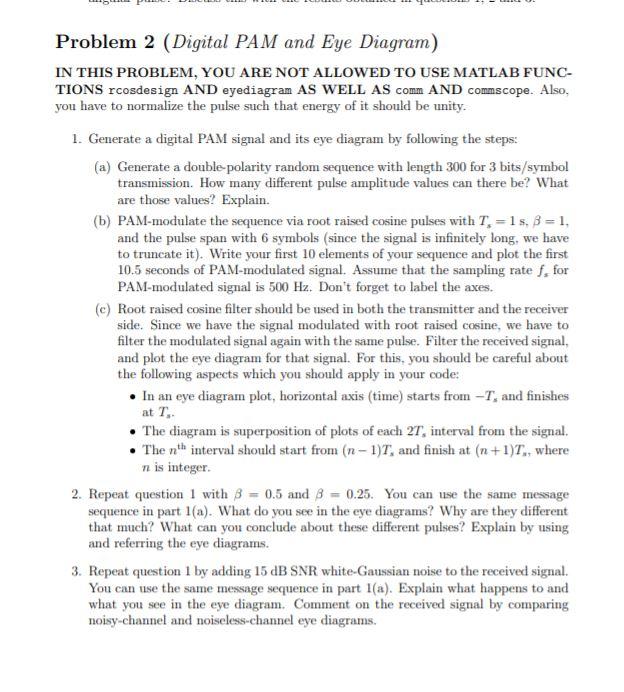
Problem 2 (Digital PAM and Eye Diagram) IN THIS PROBLEM, YOU ARE NOT ALLOWED TO USE MATLAB FUNC- TIONS rcosdesign AND eyediagram AS WELL AS comm AND commscope. Also, you have to normalize the pulse such that energy of it should be unity. 1. Generate a digital PAM signal and its eye diagram by following the steps: (a) Generate a double-polarity random sequence with length 300 for 3 bits/symbol transmission. How many different pulse amplitude values can there be? What are those values? Explain. (b) PAM-modulate the sequence via root raised cosine pulses with T. = 15, B = 1, and the pulse span with 6 symbols (since the signal is infinitely long, we have to truncate it). Write your first 10 elements of your sequence and plot the first 10.5 seconds of PAM-modulated signal. Assume that the sampling rate f. for PAM-modulated signal is 500 Hz. Don't forget to label the axes. (c) Root raised cosine filter should be used in both the transmitter and the receiver side. Since we have the signal modulated with root raised cosine, we have to filter the modulated signal again with the same pulse. Filter the received signal, and plot the eye diagram for that signal. For this, you should be careful about the following aspects which you should apply in your code: In an eye diagram plot, horizontal axis (time) starts from -T, and finishes The diagram is superposition of plots of each 2T, interval from the signal. The nth interval should start from (n-1)T, and finish at (n+1)T., where in is integer. 2. Repeat question 1 with 8 = 0.5 and 8 = 0.25. You can use the same message sequence in part 1(a). What do you see in the eye diagrams? Why are they different that much? What can you conclude about these different pulses? Explain by using and referring the eye diagrams. 3. Repeat question 1 by adding 15 dB SNR white-Gaussian noise to the received signal. You can use the same message sequence in part 1(a). Explain what happens to and what you see in the eye diagram. Comment on the received signal by comparing noisy-channel and noiseless-channel eye diagrams. at T


