

Answered step by step
Verified Expert Solution
Question
1 Approved Answer
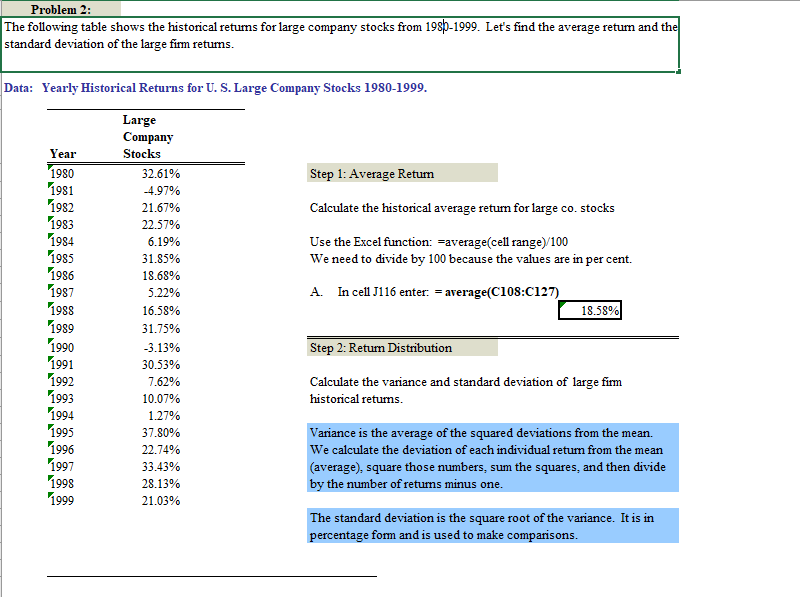
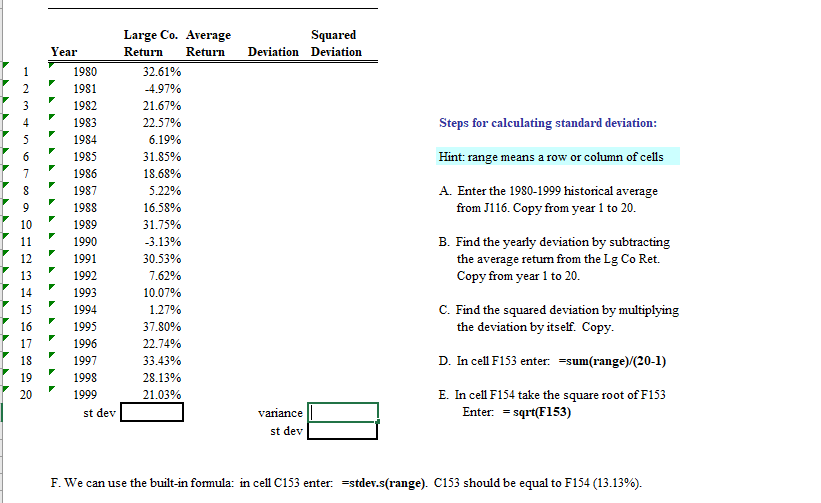
Problem 2: The following table shows the historical returns for large company stocks from 1985-1999. Let's find the average retum and the standard deviation of
Step by Step Solution
There are 3 Steps involved in it
Step: 1

Get Instant Access to Expert-Tailored Solutions
See step-by-step solutions with expert insights and AI powered tools for academic success
Step: 2

Step: 3
Ace Your Homework with AI
Get the answers you need in no time with our AI-driven, step-by-step assistance
Get Started
The 3 Signal The Investing Technique That Will Change Your Life
Authors: Jason Kelly
1st Edition
0142180955, 978-0142180952