

Answered step by step
Verified Expert Solution
Question
1 Approved Answer
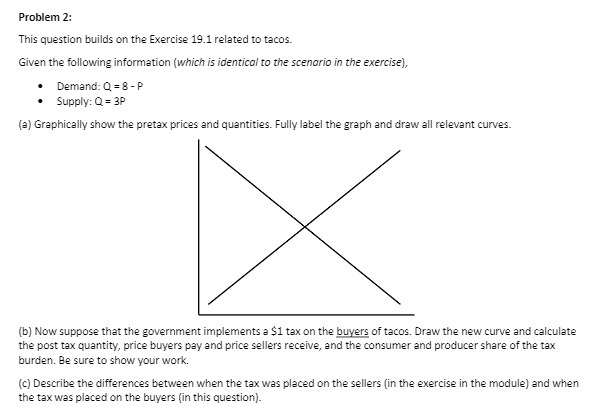
Problem 2: This question builds on the Exercise 19.1 related to tacos. Given the following information (which is identical to the scenario in the exercise),
Step by Step Solution
There are 3 Steps involved in it
Step: 1

Get Instant Access to Expert-Tailored Solutions
See step-by-step solutions with expert insights and AI powered tools for academic success
Step: 2

Step: 3
Ace Your Homework with AI
Get the answers you need in no time with our AI-driven, step-by-step assistance
Get Started
Environmental And Natural Resource Economics
Authors: Thomas H Tietenberg, Lynne Lewis
10th Edition
1315523965, 9781315523965