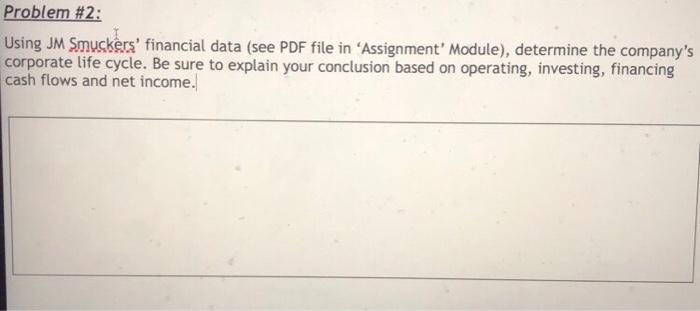
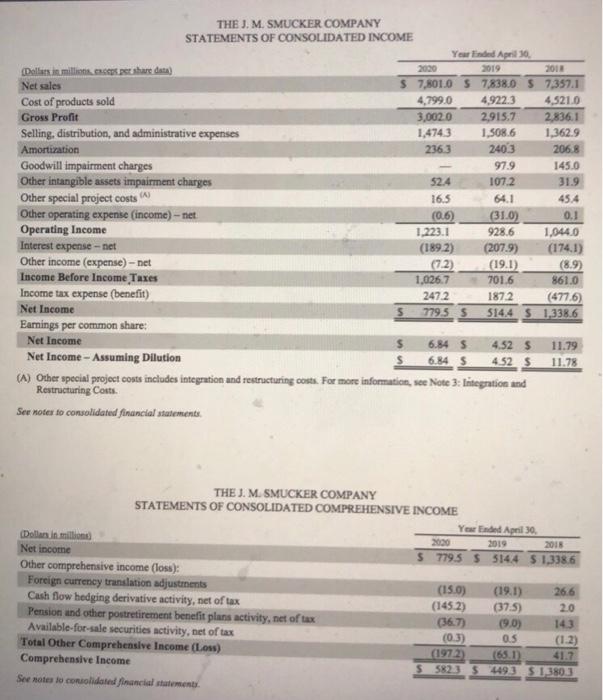
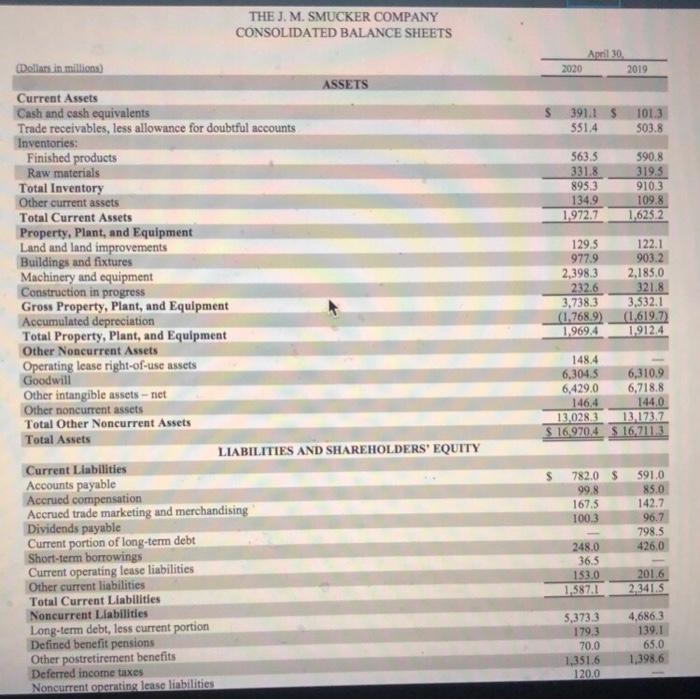
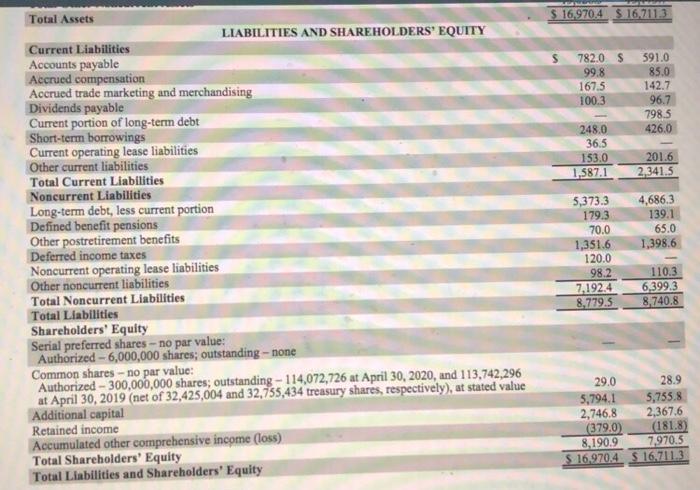
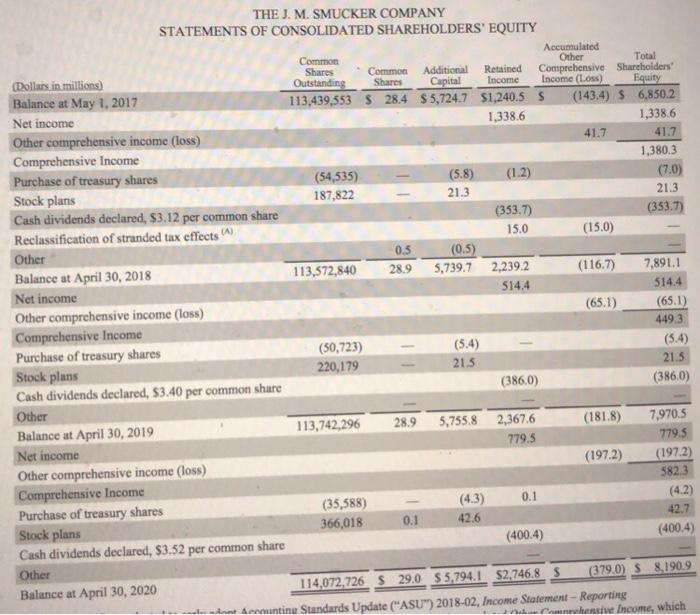
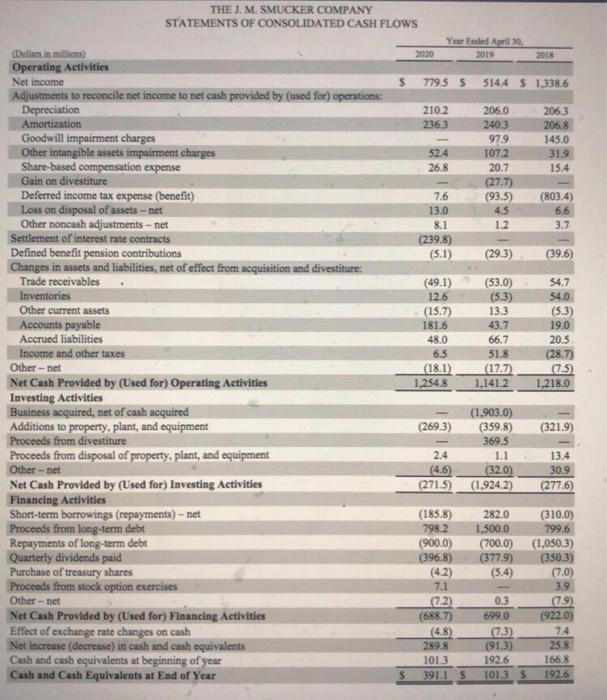
Problem #2: Using JM Smuckers' financial data (see PDF file in 'Assignment' Module), determine the company's corporate life cycle. Be sure to explain your conclusion based on operating, investing, financing cash flows and net income. THE J. M. SMUCKER COMPANY STATEMENTS OF CONSOLIDATED INCOME Yearded April 10 (Dollarsimin e peshare data 2019 2011 Net sales $ 7,801,0 $ 7,838.0 S 7,357.1 Cost of products sold 4,799.0 4,922.3 4,5210 Gross Profit 3,0020 2,915.7 2.836.1 Selling, distribution, and administrative expenses 1,4743 1,5086 1,362.9 Amortization 2363 2403 206.8 Goodwill impairment charges 97.9 145.0 Other intangible assets impairment charges 52.4 107.2 31.9 Other special project costs (A) 16.5 64.1 45.4 Other operating expense (income) - net (0.6) (31.0) 0.1 Operating Income 1.223.1 928.6 1.8440 Interest expense - net (1892) (207.9) (1741) Other income (expense) - net (7.2) (19.1) (8.9) Income Before Income Taxes 1,026.7 701.6 861.0 Income tax expense (benefit) 2472 1872 (477.6) Net Income 5 779.5 514.4 $1,338.6 Earnings per common share: Net Income $ 6.84 5 4.525 11.79 Net Income - Assuming Dilution S 6.84 5 4.525 11.78 (A) Other special project costs includes integration and restructuring costs. For more information, see Note 3: Integration and Restructuring Costs. See notes to consolidated financial statement. THE J. M. SMUCKER COMPANY STATEMENTS OF CONSOLIDATED COMPREHENSIVE INCOME Year Ended April 30 Dollar in million 2019 2015 Net income $ 7795 $3144 $1,3386 Other comprehensive income (loss): Foreign currency translation adjustments (15.0) (19.1) 26.6 Cash flow hedging derivative activity, net of tax (1452) (37.5) 2.0 Pension and other portretirement benefit plans activity, net of tax (3627) (90) 143 Available for sale securities activity, net of tax (0.3) 0.5 Total Other Comprehensive Income (Loss) (1972 (65.1) 41.7 Comprehensive Income $ 582354493 S 13803 See notes to consolidated financial statement (1.2) THE J. M. SMUCKER COMPANY CONSOLIDATED BALANCE SHEETS April 30 2020 2019 391.1 S 551.4 101.3 503.8 563.5 331.8 895.3 1349 1,972.7 590.8 319.3 910.3 109.8 1.6252 129.5 977.9 2,398.3 232.6 3,738.3 (1.768.9) 1.969.4 122.1 903.2 2,185.0 321.8 3,532.1 (1.619.7) 1912.4 Dellors in millions ASSETS Current Assets Cash and cash equivalents Trade receivables, less allowance for doubtful accounts Inventories: Finished products Raw materials Total Inventory Other current assets Total Current Assets Property. Plant, and Equipment Land and land improvements Buildings and fixtures Machinery and equipment Construction in progress Gross Property, Plant, and Equipment Accumulated depreciation Total Property, Plant, and Equipment Other Noncurrent Assets Operating lease right-of-use assets Goodwill Other intangible assets - net Other noncurrent assets Total Other Noncurrent Assets Total Assets LIABILITIES AND SHAREHOLDERS' EQUITY Current Liabilities Accounts payable Accrued compensation Accrued trade marketing and merchandising Dividends payable Current portion of long-term debt Short-term borrowings Current operating lease liabilities Other current liabilities Total Current Liabilities Noncurrent Liabilities Long-term debt, less current portion Defined benefit pensions Other postretirement benefits Deferred income taxes Noncurrent operating lease liabilities 148.4 6,304,5 6,310,9 6,429.0 6,718.8 146,4 144.0 13,0283 13.173.7 $ 16,970.4 $ 16,711,3 782.0 $ 99.8 167.5 100.3 591.0 85.0 142.7 96.7 798.5 426,0 248.0 36,5 153.0 1.587.1 2016 2.341.5 5,373.3 179,3 700 1,351.6 120.0 4,686,3 139.1 65.0 1,398.6 $ 16,970.4 $167113 S 7820 $ 99.8 167.5 100.3 591.0 85.0 142.7 96.7 798.5 426.0 248.0 36.5 153.0 1,587.1 201.6 2,341.5 4,686,3 139.1 65.0 1,398.6 Total Assets LIABILITIES AND SHAREHOLDERS' EQUITY Current Liabilities Accounts payable Accrued compensation Accrued trade marketing and merchandising Dividends payable Current portion of long-term debt Short-term borrowings Current operating lease liabilities Other current liabilities Total Current Liabilities Noncurrent Liabilities Long-term debt, less current portion Defined benefit pensions Other postretirement benefits Deferred income taxes Noncurrent operating lease liabilities Other noncurrent liabilities Total Noncurrent Liabilities Total Liabilities Shareholders' Equity Serial preferred shares - no par value: Authorized - 6,000,000 shares; outstanding - none Common shares -- no par value: Authorized - 300,000,000 shares; outstanding - 114,072,726 at April 30, 2020, and 113,742,296 at April 30, 2019 (net of 32,425,004 and 32,755,434 treasury shares, respectively), at stated value Additional capital Retained income Accumulated other comprehensive income (loss) Total Shareholders' Equity Total Liabilities and Shareholders' Equity 5,373.3 179.3 70.0 1,351.6 120.0 98.2 7.192.4 8.779.5 110.3 6,399.3 8,740.8 29.0 28.9 5,794,1 5,755.8 2,746.8 2,367.6 (379.0 (181.8) 8,190.9 $ 16,970.4 $ 16.711.3 7970.5 THE J. M. SMUCKER COMPANY STATEMENTS OF CONSOLIDATED SHAREHOLDERS' EQUITY Accumulated Common Other Total Shares Common Additional Retained Dollars in millions) Comprehensive Shareholders Outstanding Shares Capital Income Income (Loss) Equity Balance at May 1, 2017 113,439,553 $ 28.4 $5,724.7 $1,240.5 S (143.4) S 6,850.2 Net income 1,338.6 1,338.6 Other comprehensive income (loss) 41.7 41.7 Comprehensive Income 1,380.3 Purchase of treasury shares (54,535) (5.8) (1.2) (7.0) Stock plans 187,822 21.3 21.3 Cash dividends declared, $3.12 per common share (353.7) (353.7) Reclassification of stranded tax effects 15.0 (15.0) Other 0.5 (0.5) Balance at April 30, 2018 113,572,840 28.9 5,739.7 2,239.2 (116.7) 7,891.1 Net income 514.4 $14.4 Other comprehensive income (loss) (65.1) (65.1) Comprehensive Income 449.3 Purchase of treasury shares (50,723) (5.4) (5.4) 220,179 Stock plans 21.5 21.5 Cash dividends declared, $3.40 per common share (386.0) (386.0) Other 113,742,296 28.9 Balance at April 30, 2019 5,755.8 2,367.6 7,970.5 (181.8) 779.5 779.5 Net income (1972) (1972) Other comprehensive income (loss) 5823 Comprehensive Income (35,588) Purchase of treasury shares (4.2) (4.3) 42.7 366,018 42.6 0.1 Stock plans (400.4) (400.4) Cash dividends declared, $3.52 per common share Other (379.0) $ 8,190.9 114,072,726 29.0 S5.794.1 $2.746.8 S Balance at April 30, 2020 Anne Amountine Standards Update ("ASU") 2018-02, Income Statement - Reporting hensive Income, which 0.1 THE J. M. SMUCKER COMPANY STATEMENTS OF CONSOLIDATED CASH FLOWS Your Faded April 2019 2020 $ 779 5 5 514.4 S 1,338.6 210.2 236,3 206.0 240.3 979 1072 20.7 (27.7) (93.5) 4.5 1.2 206,3 206.8 145.0 319 15.4 52.4 26.8 7.6 13.0 8.1 (239.8) (5.1) (803.4) 6.6 3.7 (29.3) (39.6) Operating Activities Net income Adjustments to reconcile net income to net cash provided by used for) operations Depreciation Amortization Goodwill impairment charges Other intangible assets impairment charges Share-based compensation expense Gain on divestiture Deferred income tax expense (benefit) Loss on disposal of assets-net Other noncash adjustments - net Settlement of interest rate contracts Defined benefit pension contributions Changes in assets and liabilities, net of effect from acquisition and divestiture: Trade receivables Inventories Other current assets Accounts payable Accrued liabilities Income and other taxes Othernet Net Cash Provided by (Used for) Operating Activities Investing Activities Business acquired, net of cash acquired Additions to property, plant, and equipment Proceeds from divestiture Proceeds from disposal of property, plant, and equipment Othet-net Net Cash Provided by (Used for) Investing Activities Financing Activities Short-term borrowings (repayments) net Proceeds from long-term debt Repayments of long-term debt Quarterly dividends paid Purchase of treasury shares Proceeds from stock option exercises Othernet Net Cash Provided by (Used for) Financing Activities Effect of exchange rate changes on cash Net increase (decrease in cash and cash equivalents Cash and cash equivalents at beginning of year Cash and Cash Equivalents at End of Year (49.1) 12.6 (15.7) 181.6 48.0 6.5 (18.1) 1,254.8 (53.0) (5.3) 13.3 43.7 66.7 51.8 (17.7) 1.141.2 54.7 54.0 (5.3) 19.0 20.5 (28.7) (7.5) 1.218.0 (321.9) (1.903.0) (269.3) (359.8) 369.5 2.4 1.1 (4.6) (320) (271.5) (1.924.2) 13.4 30.9 (277.6) (185.8) 7982 (900.0) (396,8) (4.2) 7.1 (22) (688.7) (4.8) 289.8 1013 39115 282.0 (310.0) 1,500.0 799.6 (700.0) (1,050.3) (377.9) (350.3) (5.4) (7.0) 3.9 0.3 (7.9) 699,0 (922.0) 74 (913) 25.8 192.6 166.8 10135 192.6 $ Problem #2: Using JM Smuckers' financial data (see PDF file in 'Assignment' Module), determine the company's corporate life cycle. Be sure to explain your conclusion based on operating, investing, financing cash flows and net income. THE J. M. SMUCKER COMPANY STATEMENTS OF CONSOLIDATED INCOME Yearded April 10 (Dollarsimin e peshare data 2019 2011 Net sales $ 7,801,0 $ 7,838.0 S 7,357.1 Cost of products sold 4,799.0 4,922.3 4,5210 Gross Profit 3,0020 2,915.7 2.836.1 Selling, distribution, and administrative expenses 1,4743 1,5086 1,362.9 Amortization 2363 2403 206.8 Goodwill impairment charges 97.9 145.0 Other intangible assets impairment charges 52.4 107.2 31.9 Other special project costs (A) 16.5 64.1 45.4 Other operating expense (income) - net (0.6) (31.0) 0.1 Operating Income 1.223.1 928.6 1.8440 Interest expense - net (1892) (207.9) (1741) Other income (expense) - net (7.2) (19.1) (8.9) Income Before Income Taxes 1,026.7 701.6 861.0 Income tax expense (benefit) 2472 1872 (477.6) Net Income 5 779.5 514.4 $1,338.6 Earnings per common share: Net Income $ 6.84 5 4.525 11.79 Net Income - Assuming Dilution S 6.84 5 4.525 11.78 (A) Other special project costs includes integration and restructuring costs. For more information, see Note 3: Integration and Restructuring Costs. See notes to consolidated financial statement. THE J. M. SMUCKER COMPANY STATEMENTS OF CONSOLIDATED COMPREHENSIVE INCOME Year Ended April 30 Dollar in million 2019 2015 Net income $ 7795 $3144 $1,3386 Other comprehensive income (loss): Foreign currency translation adjustments (15.0) (19.1) 26.6 Cash flow hedging derivative activity, net of tax (1452) (37.5) 2.0 Pension and other portretirement benefit plans activity, net of tax (3627) (90) 143 Available for sale securities activity, net of tax (0.3) 0.5 Total Other Comprehensive Income (Loss) (1972 (65.1) 41.7 Comprehensive Income $ 582354493 S 13803 See notes to consolidated financial statement (1.2) THE J. M. SMUCKER COMPANY CONSOLIDATED BALANCE SHEETS April 30 2020 2019 391.1 S 551.4 101.3 503.8 563.5 331.8 895.3 1349 1,972.7 590.8 319.3 910.3 109.8 1.6252 129.5 977.9 2,398.3 232.6 3,738.3 (1.768.9) 1.969.4 122.1 903.2 2,185.0 321.8 3,532.1 (1.619.7) 1912.4 Dellors in millions ASSETS Current Assets Cash and cash equivalents Trade receivables, less allowance for doubtful accounts Inventories: Finished products Raw materials Total Inventory Other current assets Total Current Assets Property. Plant, and Equipment Land and land improvements Buildings and fixtures Machinery and equipment Construction in progress Gross Property, Plant, and Equipment Accumulated depreciation Total Property, Plant, and Equipment Other Noncurrent Assets Operating lease right-of-use assets Goodwill Other intangible assets - net Other noncurrent assets Total Other Noncurrent Assets Total Assets LIABILITIES AND SHAREHOLDERS' EQUITY Current Liabilities Accounts payable Accrued compensation Accrued trade marketing and merchandising Dividends payable Current portion of long-term debt Short-term borrowings Current operating lease liabilities Other current liabilities Total Current Liabilities Noncurrent Liabilities Long-term debt, less current portion Defined benefit pensions Other postretirement benefits Deferred income taxes Noncurrent operating lease liabilities 148.4 6,304,5 6,310,9 6,429.0 6,718.8 146,4 144.0 13,0283 13.173.7 $ 16,970.4 $ 16,711,3 782.0 $ 99.8 167.5 100.3 591.0 85.0 142.7 96.7 798.5 426,0 248.0 36,5 153.0 1.587.1 2016 2.341.5 5,373.3 179,3 700 1,351.6 120.0 4,686,3 139.1 65.0 1,398.6 $ 16,970.4 $167113 S 7820 $ 99.8 167.5 100.3 591.0 85.0 142.7 96.7 798.5 426.0 248.0 36.5 153.0 1,587.1 201.6 2,341.5 4,686,3 139.1 65.0 1,398.6 Total Assets LIABILITIES AND SHAREHOLDERS' EQUITY Current Liabilities Accounts payable Accrued compensation Accrued trade marketing and merchandising Dividends payable Current portion of long-term debt Short-term borrowings Current operating lease liabilities Other current liabilities Total Current Liabilities Noncurrent Liabilities Long-term debt, less current portion Defined benefit pensions Other postretirement benefits Deferred income taxes Noncurrent operating lease liabilities Other noncurrent liabilities Total Noncurrent Liabilities Total Liabilities Shareholders' Equity Serial preferred shares - no par value: Authorized - 6,000,000 shares; outstanding - none Common shares -- no par value: Authorized - 300,000,000 shares; outstanding - 114,072,726 at April 30, 2020, and 113,742,296 at April 30, 2019 (net of 32,425,004 and 32,755,434 treasury shares, respectively), at stated value Additional capital Retained income Accumulated other comprehensive income (loss) Total Shareholders' Equity Total Liabilities and Shareholders' Equity 5,373.3 179.3 70.0 1,351.6 120.0 98.2 7.192.4 8.779.5 110.3 6,399.3 8,740.8 29.0 28.9 5,794,1 5,755.8 2,746.8 2,367.6 (379.0 (181.8) 8,190.9 $ 16,970.4 $ 16.711.3 7970.5 THE J. M. SMUCKER COMPANY STATEMENTS OF CONSOLIDATED SHAREHOLDERS' EQUITY Accumulated Common Other Total Shares Common Additional Retained Dollars in millions) Comprehensive Shareholders Outstanding Shares Capital Income Income (Loss) Equity Balance at May 1, 2017 113,439,553 $ 28.4 $5,724.7 $1,240.5 S (143.4) S 6,850.2 Net income 1,338.6 1,338.6 Other comprehensive income (loss) 41.7 41.7 Comprehensive Income 1,380.3 Purchase of treasury shares (54,535) (5.8) (1.2) (7.0) Stock plans 187,822 21.3 21.3 Cash dividends declared, $3.12 per common share (353.7) (353.7) Reclassification of stranded tax effects 15.0 (15.0) Other 0.5 (0.5) Balance at April 30, 2018 113,572,840 28.9 5,739.7 2,239.2 (116.7) 7,891.1 Net income 514.4 $14.4 Other comprehensive income (loss) (65.1) (65.1) Comprehensive Income 449.3 Purchase of treasury shares (50,723) (5.4) (5.4) 220,179 Stock plans 21.5 21.5 Cash dividends declared, $3.40 per common share (386.0) (386.0) Other 113,742,296 28.9 Balance at April 30, 2019 5,755.8 2,367.6 7,970.5 (181.8) 779.5 779.5 Net income (1972) (1972) Other comprehensive income (loss) 5823 Comprehensive Income (35,588) Purchase of treasury shares (4.2) (4.3) 42.7 366,018 42.6 0.1 Stock plans (400.4) (400.4) Cash dividends declared, $3.52 per common share Other (379.0) $ 8,190.9 114,072,726 29.0 S5.794.1 $2.746.8 S Balance at April 30, 2020 Anne Amountine Standards Update ("ASU") 2018-02, Income Statement - Reporting hensive Income, which 0.1 THE J. M. SMUCKER COMPANY STATEMENTS OF CONSOLIDATED CASH FLOWS Your Faded April 2019 2020 $ 779 5 5 514.4 S 1,338.6 210.2 236,3 206.0 240.3 979 1072 20.7 (27.7) (93.5) 4.5 1.2 206,3 206.8 145.0 319 15.4 52.4 26.8 7.6 13.0 8.1 (239.8) (5.1) (803.4) 6.6 3.7 (29.3) (39.6) Operating Activities Net income Adjustments to reconcile net income to net cash provided by used for) operations Depreciation Amortization Goodwill impairment charges Other intangible assets impairment charges Share-based compensation expense Gain on divestiture Deferred income tax expense (benefit) Loss on disposal of assets-net Other noncash adjustments - net Settlement of interest rate contracts Defined benefit pension contributions Changes in assets and liabilities, net of effect from acquisition and divestiture: Trade receivables Inventories Other current assets Accounts payable Accrued liabilities Income and other taxes Othernet Net Cash Provided by (Used for) Operating Activities Investing Activities Business acquired, net of cash acquired Additions to property, plant, and equipment Proceeds from divestiture Proceeds from disposal of property, plant, and equipment Othet-net Net Cash Provided by (Used for) Investing Activities Financing Activities Short-term borrowings (repayments) net Proceeds from long-term debt Repayments of long-term debt Quarterly dividends paid Purchase of treasury shares Proceeds from stock option exercises Othernet Net Cash Provided by (Used for) Financing Activities Effect of exchange rate changes on cash Net increase (decrease in cash and cash equivalents Cash and cash equivalents at beginning of year Cash and Cash Equivalents at End of Year (49.1) 12.6 (15.7) 181.6 48.0 6.5 (18.1) 1,254.8 (53.0) (5.3) 13.3 43.7 66.7 51.8 (17.7) 1.141.2 54.7 54.0 (5.3) 19.0 20.5 (28.7) (7.5) 1.218.0 (321.9) (1.903.0) (269.3) (359.8) 369.5 2.4 1.1 (4.6) (320) (271.5) (1.924.2) 13.4 30.9 (277.6) (185.8) 7982 (900.0) (396,8) (4.2) 7.1 (22) (688.7) (4.8) 289.8 1013 39115 282.0 (310.0) 1,500.0 799.6 (700.0) (1,050.3) (377.9) (350.3) (5.4) (7.0) 3.9 0.3 (7.9) 699,0 (922.0) 74 (913) 25.8 192.6 166.8 10135 192.6 $
