
Problem 20-04 (Part Level Submission)
Cheyenne Company sponsors a defined benefit pension plan. The following information related to the pension plan is available for 2020 and 2021.
2020
2021
Plan assets (fair value), December 31 $810,840 $984,840
Projected benefit obligation, January 1 812,000 928,000
Pension asset/liability, January 1 162,400 Cr. ?
Prior service cost, January 1 290,000 278,400
Service cost 69,600 104,400
Actual and expected return on plan assets 27,840 34,800
Amortization of prior service cost 11,600 13,920
Contributions (funding) 133,400 139,200
Accumulated benefit obligation, December 31 580,000 638,000
Interest/settlement rate 9 % 9 %
(a)
Compute pension expense for 2020 and 2021.
Pension expense for 2020 $
Pension expense for 2021 $
Drake Co. budgeted merchandise purchase of 40,000 units next month. The expected beginning inventory is 12,000 units next month. The expected beginning inventory is 12,000 units and the desired inventory at the end of next month is 15,000 units. Budgeted sales in units next month is.
Group of answer choices
43,000
52,000
37,000
55,000
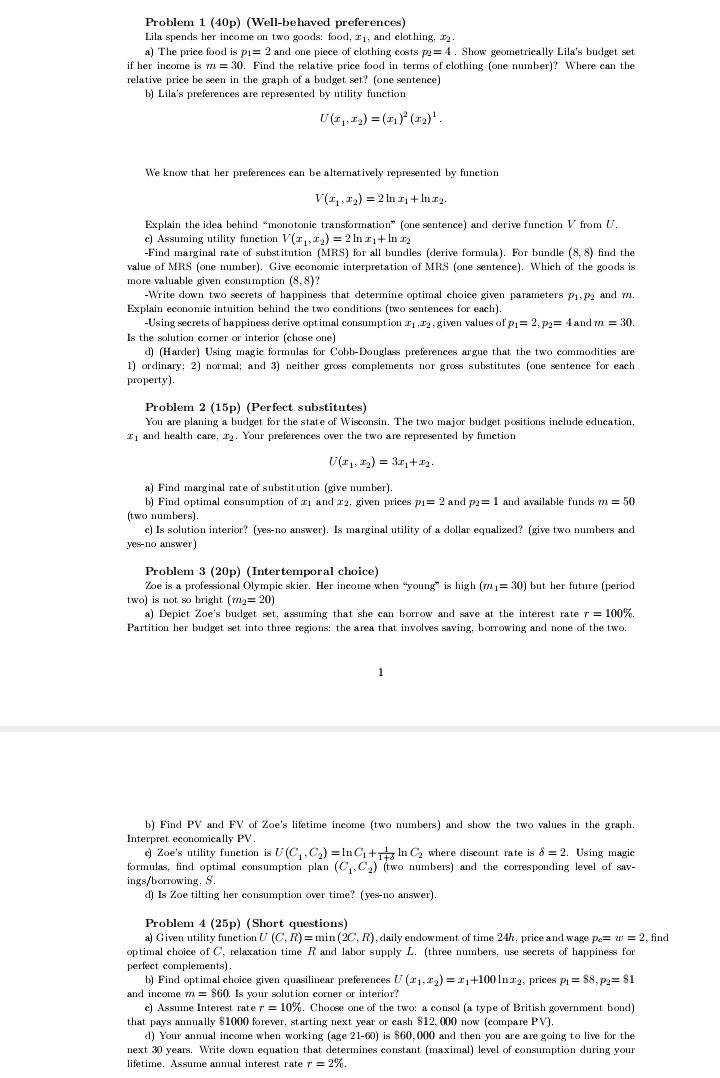
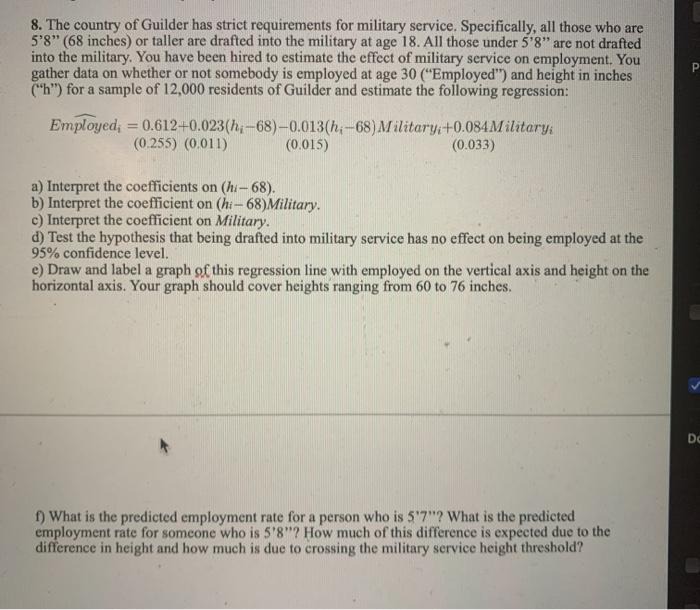
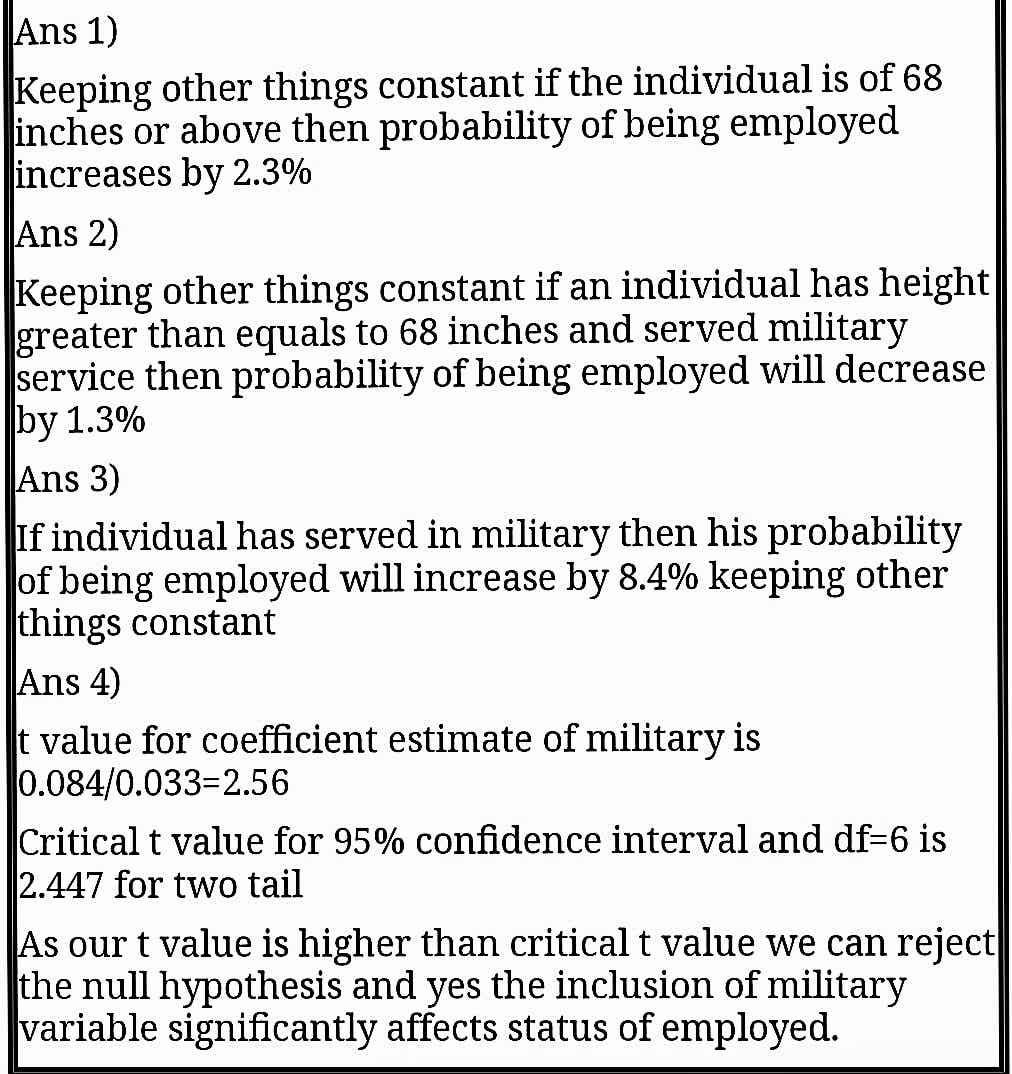
Problem 1 (40p) (Well-behaved preferences) Lila spends her income on two goods: food, I1, and clothing, 12. a) The price food is pi= 2 and one piece of clothing costs p= 4 . Show geometrically Lila's budget set if her income is m = 30. Find the relative price food in terms of clothing (one number)? Where can the relative price be seen in the graph of a budget set? (one sentence) b) Lila's preferences are represented by utility function We know that her preferences can be alternatively represented by function V(1 .1)) = 2 In 1 + In12. Explain the idea behind "monotonic transformation" (one sentence) and derive function V from U. ") Assuming utility function V(3], 2,) = 2In1+ Inc2 -Find marginal rate of substitution (MRS) for all bundles (derive formula). For bundle (8, 8) find the value of MRS (one number). Give economic interpretation of MRS (one sentence). Which of the goods is more valuable given consumption (8. 8)? -Write down two secrets of happiness that determine optimal choice given parameters pi, p, and m. Explain economic intuition behind the two conditions (two sentences for each). -Using secrets of happiness derive optimal consumption 21 ,72 , given values of p1 = 2, py= 4 and m = 30. Is the solution corner or interior (chose one) d) (Harder) Using magic formulas for Cobb-Douglass preferences argue that the two commodities are 1) ordinary; 2) normal; and 3) neither gross complements nor gross substitutes (one sentence for each property ). Problem 2 (15p) (Perfect substitutes) You are planing a budget for the state of Wisconsin. The two major budget positions include education, I1 and health care, T2. Your preferences over the two are represented by function a) Find marginal rate of substitution (give number). b) Find optimal consumption of ci and 12, given prices pi= 2 and pa= 1 and available funds m = 50 (two numbers). c) Is solution interior? (yes-no answer). Is marginal utility of a dollar equalized? (give two numbers and yes-no answer ) Problem 3 (20p) (Intertemporal choice) Zoe is a professional Olympic skier. Her income when "young" is high (m, = 30) but her future (period two) is not so bright (my= 20) a) Depict Zoe's budget set, assuming that she can borrow and save at the interest rate r = 100%. Partition her budget set into three regions: the area that involves saving. borrowing and none of the two. b) Find PV and FV of Zoe's lifetime income (two numbers) and show the two values in the graph. Interpret economically PV. " Zoe's utility function is U(C,, C) = InC,+1 In C, where discount rate is $ = 2. Using magic formulas, find optimal consumption plan (C.(2) (two numbers) and the corresponding level of sav- ings/borrowing. S. dj Is Zoe tilting her consumption over time? (yes-no answer). Problem 4 (25p) (Short questions) aj Given utility function U (C. R) = min (20, R), daily endowment of time 24h, price and wage pe= w = 2, find optimal choice of C, relaxation time R and labor supply L. (three numbers, use secrets of happiness for perfect complements). b) Find optimal choice given quasilinear preferences ( (31, 22) = 214100 Inc2, prices p, = $8, p2= $1 and income m = $60. Is your solution corner or interior! c) Assume Interest rate r = 10%. Choose one of the two: a consol (a type of British government bond) that pays annually $1000 forever, starting next year or cash $12, 000 now (compare PV). d) Your annual income when working (age 21-60) is $60, 000 and then you are are going to live for the next 30 years. Write down equation that determines constant (maximal) level of consumption during your lifetime. Assume annual interest rate r = 2%.8. The country of Guilder has strict requirements for military service. Specifically, all those who are 5'8" (68 inches) or taller are drafted into the military at age 18. All those under 5'8" are not drafted into the military. You have been hired to estimate the effect of military service on employment. You gather data on whether or not somebody is employed at age 30 ("Employed") and height in inches ("h") for a sample of 12,000 residents of Guilder and estimate the following regression: Employed, = 0.612+0.023(h;-68)-0.013(h; -68) Military: +0.084Military; (0.255) (0.011) (0.015) (0.033) a) Interpret the coefficients on (hi-68). b) Interpret the coefficient on (hi- 68)Military. c) Interpret the coefficient on Military. d) Test the hypothesis that being drafted into military service has no effect on being employed at the 95% confidence level. e) Draw and label a graph of this regression line with employed on the vertical axis and height on the horizontal axis. Your graph should cover heights ranging from 60 to 76 inches. f) What is the predicted employment rate for a person who is 5'7"? What is the predicted employment rate for someone who is 5'8"? How much of this difference is expected due to the difference in height and how much is due to crossing the military service height threshold?Ans 1) Keeping other things constant if the individual is of 68 inches or above then probability of being employed increases by 2.3% Ans 2) Keeping other things constant if an individual has height greater than equals to 68 inches and served military service then probability of being employed will decrease by 1.3% Ans 3) If individual has served in military then his probability of being employed will increase by 8.4% keeping other things constant Ans 4) t value for coefficient estimate of military is 0.084/0.033=2.56 Critical t value for 95% confidence interval and df=6 is 2.447 for two tail As our t value is higher than critical t value we can reject the null hypothesis and yes the inclusion of military variable significantly affects status of employed.Question 4) Beer Demand (35 points) Suppose you have the following estimated regressions for beer consumption with 123 observations. Modell : B =2.43-1.22P +2.35Y R' =0.48 (1.1) (0.18) (0.65) Model 2 : B =1.85-1.07P+1.98Y -0.42PR R' =0.59 (0.13) (054) (0.16) Model3 : B =2.97-1.38P R' =0.39 (12) (0.13) Model 4 : B =1.24-0.87 P+1.48Y -0.32PR+0.18PO R' =0.60 (1.1) (0.20) (0.44) (0.13) 0.99 Where P is price index for beer, Y represents the income index, PR is the price of raki, PO represents price of oil and B represents the bottles of beers consumed. You are also given that B = 5, Y =1750, P =8, PR=85, PO = 45. a) Can you test the overall significance for the effect of price of beer, income and price of raki on beer demand? If YES, provide test result. If NO, explain your reasoning. b) Use an F-test approach to Test the following hypotheses. 1) Price of oil and price of raki jointly affects the demand for beer. ii) Income does not affect the demand for beer. iii) Price of oil, income and price of raki jointly affects the demand for beer. iv) Price of oil does not affect the demand for beer. c) Do you agree with inclusion of price of oil in the regression estimations? Suggest other variables to be included in the demand line of beer. Justify your answer. d) Is beer an inferior good? Support your answer with statistical evidence. e) Can you determine the price elasticity of demand for beer? If YES, provide test result. If NO, explain your reasoning f) Are beer and raki substitutes? Support your answer with statistical evidence. g) Suppose that a researcher estimates Model 1 with a dependent variable of BT which is measured in 10 bottles of beer. Write down the results obtained by the researcher