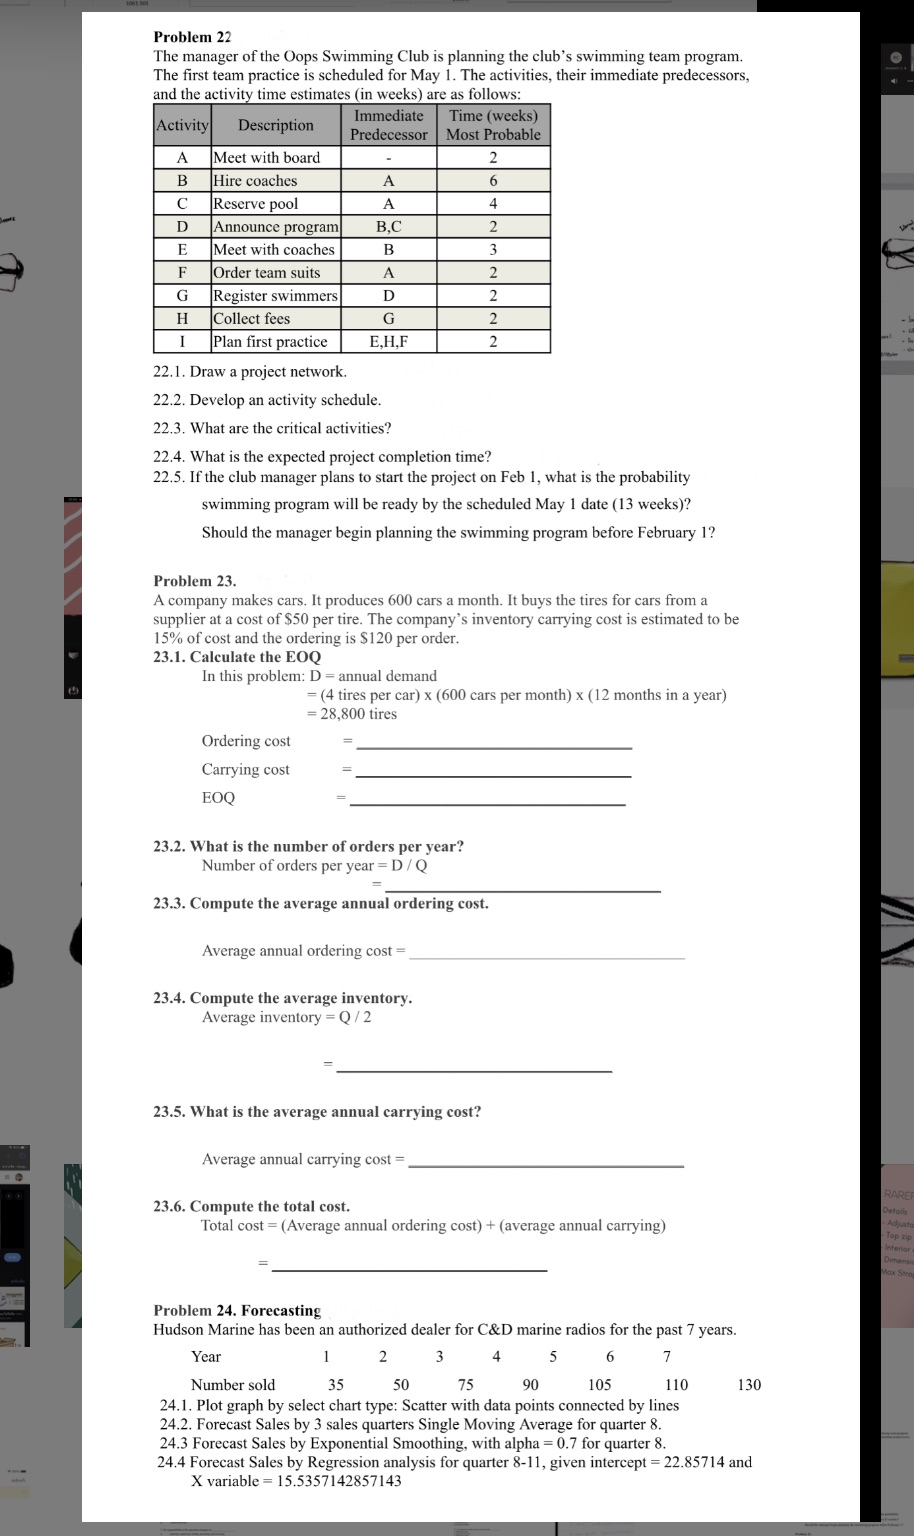
Problem 22 The manager of the Oops Swimming Club is planning the club's swimming team program The rst team practice is scheduled for May 1. The activities, their immediate predecessors, and the activi time estimates (in weeks) are as follows: Meet with board ' ' coaches Lb _- W 5 8 5 HHI escrvc pool .55 0 Meet with coaches I :er team suits Register swimmers illect Plan rst practice 3' E.H,F 22. l . Draw a project network. 2.2. Develop an activity schedule. 22.3. What are the critical activities? 22.4. What is the expected project completion time? 22.5. If tlte club manager plans to start the project on Feb 1, what is the probability Swimming program will be ready by the scheduled May 1 date (13 weeks)? Should the manager begin planning the swimming program before February 1'? Proble'm 2.3. A Company makes cars. it produces 600 cars a month. It buys the tires for cars from a supplier at a cost of $50 per tire. The company's inventory carrying cost is estimated to he 15% of cost and the ordering is 5120 per order. 23.1. Calculate the EOQ In this problem: D = annual demand = (4 tires per car) it [600 cars per month) it {12 months in a year) = 28.800 tires Ordering cost Carrying cost 1300 23.2. What is the number of orders per year? Number of orders per year = D I Q 23.3. Compute the average annual ordering cost. Averagc annual ordering cost = 23.4. Compute the average inventory. Average inventory = Q I 2 23.5. What is the average annual carrying coat? Average annual Carrying cost = 23.6. Compute the total cost. Total cost = [Average annual ordering cost) + (average annual carrying) Problem 24. Forecasting Hudson Marine has been an authorized dealer for C&D marine radios for the past ? years. Year 1 2 3 4 5 6 7' Number sold 35 50 2-'5 90 105 110 24.1. Plot graph by select chart type: Scatter with data points connected by lines 24.2. Forecast Sales by 3 sales quarters Single Moving Average for quarter 8. 24.3 Forecast Sales by Exponential Smoothing, with alpha = 0.7 for quarter 8. 24.4 Forecast Sales by Regression analysis for quarter 8-1], given intercept = 22.85714 and X variable = [5.535T142857143


