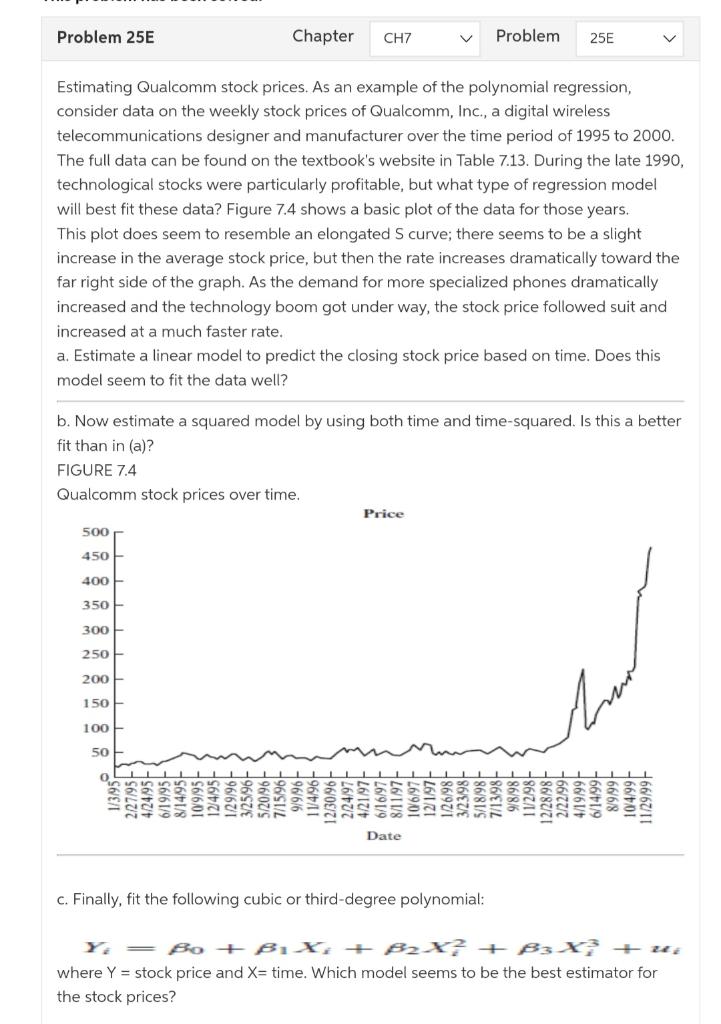
Problem 25E Chapter CH7 Problem 25E Estimating Qualcomm stock prices. As an example of the polynomial regression, consider data on the weekly stock prices of Qualcomm, Inc., a digital wireless telecommunications designer and manufacturer over the time period of 1995 to 2000. The full data can be found on the textbook's website in Table 7.13. During the late 1990, technological stocks were particularly profitable, but what type of regression model will best fit these data? Figure 7.4 shows a basic plot of the data for those years. This plot does seem to resemble an elongated S curve; there seems to be a slight increase in the average stock price, but then the rate increases dramatically toward the far right side of the graph. As the demand for more specialized phones dramatically increased and the technology boom got under way, the stock price followed suit and increased at a much faster rate. a. Estimate a linear model to predict the closing stock price based on time. Does this model seem to fit the data well? b. Now estimate a squared model by using both time and time-squared. Is this a better fit than in (a)? FIGURE 7.4 Qualcomm stock prices over time. Price 500 450 400 350 300 250 200 150 100 50 0 LL 6/19/95- 8/14/95- 10/9/95- 12/4/95- -96/67/1 3/25/96- 5/20/96 7/15/96 -96/6/6 L LL L 11/4/96 12/30/96 2/24/97- 4/21/97- 6/16/97 8/11/97- 10/6/97- 12/1/97- 3/23/98- 5/18/98 7/13/98 7801901 06/07/1 -86/8/6 11/2/98 12/28/98 2/22/99- 6/14/99- 4/19/99 -66/6/8 10/4/99- 11/29/99- 10 99 374 122 Date c. Finally, fit the following cubic or third-degree polynomial: = Bo + BX; + BX + B3X? + u; where Y = stock price and X= time. Which model seems to be the best estimator for the stock prices? Problem 25E Chapter CH7 Problem 25E Estimating Qualcomm stock prices. As an example of the polynomial regression, consider data on the weekly stock prices of Qualcomm, Inc., a digital wireless telecommunications designer and manufacturer over the time period of 1995 to 2000. The full data can be found on the textbook's website in Table 7.13. During the late 1990, technological stocks were particularly profitable, but what type of regression model will best fit these data? Figure 7.4 shows a basic plot of the data for those years. This plot does seem to resemble an elongated S curve; there seems to be a slight increase in the average stock price, but then the rate increases dramatically toward the far right side of the graph. As the demand for more specialized phones dramatically increased and the technology boom got under way, the stock price followed suit and increased at a much faster rate. a. Estimate a linear model to predict the closing stock price based on time. Does this model seem to fit the data well? b. Now estimate a squared model by using both time and time-squared. Is this a better fit than in (a)? FIGURE 7.4 Qualcomm stock prices over time. Price 500 450 400 350 300 250 200 150 100 50 0 LL 6/19/95- 8/14/95- 10/9/95- 12/4/95- -96/67/1 3/25/96- 5/20/96 7/15/96 -96/6/6 L LL L 11/4/96 12/30/96 2/24/97- 4/21/97- 6/16/97 8/11/97- 10/6/97- 12/1/97- 3/23/98- 5/18/98 7/13/98 7801901 06/07/1 -86/8/6 11/2/98 12/28/98 2/22/99- 6/14/99- 4/19/99 -66/6/8 10/4/99- 11/29/99- 10 99 374 122 Date c. Finally, fit the following cubic or third-degree polynomial: = Bo + BX; + BX + B3X? + u; where Y = stock price and X= time. Which model seems to be the best estimator for the stock prices