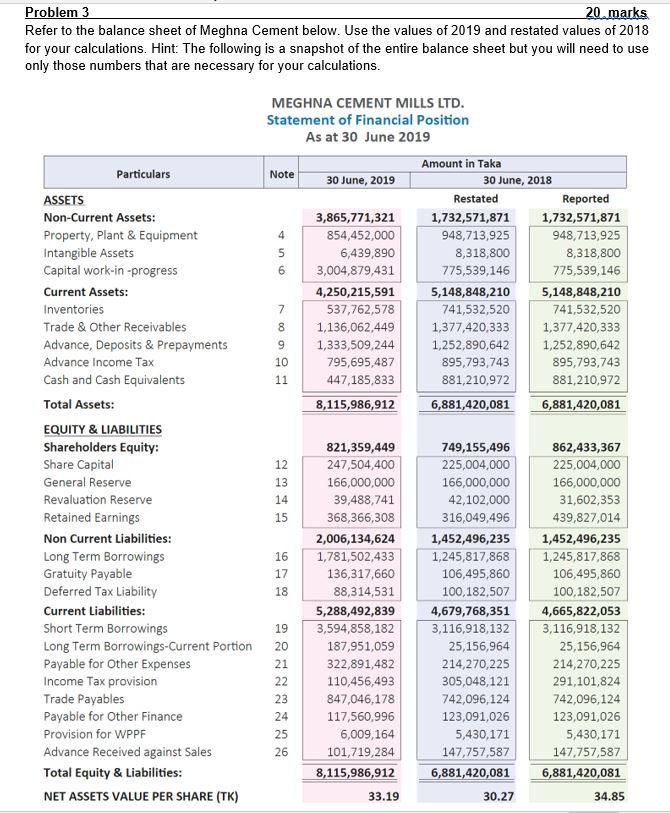

Problem 3 20.marks Refer to the balance sheet of Meghna Cement below. Use the values of 2019 and restated values of 2018 for your calculations. Hint: The following is a snapshot of the entire balance sheet but you will need to use only those numbers that are necessary for your calculations. MEGHNA CEMENT MILLS LTD. Statement of Financial Position As at 30 June 2019 Amount in Taka Note 30 June, 2019 30 June, 2018 Restated Reported 3,865,771,321 1,732,571,871 1,732,571,871 4 854,452,000 948,713,925 948,713,925 5 6,439,890 8,318,800 8,318,800 6 3,004,879,431 775,539,146 775,539,146 4,250,215,591 5,148,848,210 5,148,848,210 7 537,762,578 741,532,520 741,532,520 8 1,136,062,449 1,377,420,333 1,377,420,333 9 1,333,509,244 1,252,890,642 1,252,890,642 10 795,695,487 895,793,743 895,793,743 11 447,185,833 881,210,972 881,210,972 8,115,986,912 6,881,420,081 6,881,420,081 in Particulars ASSETS Non-Current Assets: Property, Plant & Equipment Intangible Assets Capital work-in-progress Current Assets: Inventories Trade & Other Receivables Advance, Deposits & Prepayments Advance Income Tax Cash and Cash Equivalents Total Assets: EQUITY & LIABILITIES Shareholders Equity: Share Capital General Reserve Revaluation Reserve Retained Earnings Non Current Liabilities: Long Term Borrowings Gratuity Payable Deferred Tax Liability Current Liabilities: Short Term Borrowings Long Term Borrowings-Current Portion Payable for Other Expenses Income Tax provision Trade Payables Payable for Other Finance Provision for WPPF Advance Received against Sales Total Equity & Liabilities: NET ASSETS VALUE PER SHARE (TK) 12 13 14 15 16 17 18 821,359,449 247,504,400 166,000,000 39,488,741 368,366,308 2,006,134,624 1,781,502,433 136,317,660 88,314,531 5,288,492,839 3,594,858,182 187,951,059 322,891,482 110,456,493 847,046,178 117,560,996 6,009,164 101,719,284 8,115,986,912 749,155,496 225,004,000 166,000,000 42,102,000 316,049,496 1,452,496,235 1,245,817,868 106,495,860 100,182,507 4,679,768,351 3,116,918,132 25,156,964 214,270,225 305,048,121 742,096,124 123,091,026 5,430,171 147,757,587 6,881,420,081 862,433,367 225,004,000 166,000,000 31,602,353 439,827,014 1,452,496,235 1,245,817,868 106,495,860 100,182,507 4,665,822,053 3,116,918,132 25,156,964 214,270,225 291,101,824 742,096,124 123,091,026 5,430,171 147,757,587 6,881,420,081 19 20 21 22 23 24 25 26 33.19 30.27 34.85 + 3.1. Calculate and interpret their Asset Quality Index (AQI) for 2019. Limit your interpretation/discussion strictly within 100 words. You can write less than 100 words, but not more. Numbers typed for showing steps of calculation are not part of word count 10 marks 3.2. Calculate and interpret their leverage index for 2019. Limit your interpretation/discussion strictly within 100 words. You can write less than 100 words, but not more. Numbers typed for showing steps of calculation are not part of word count. 10 marks Problem 3 20.marks Refer to the balance sheet of Meghna Cement below. Use the values of 2019 and restated values of 2018 for your calculations. Hint: The following is a snapshot of the entire balance sheet but you will need to use only those numbers that are necessary for your calculations. MEGHNA CEMENT MILLS LTD. Statement of Financial Position As at 30 June 2019 Amount in Taka Note 30 June, 2019 30 June, 2018 Restated Reported 3,865,771,321 1,732,571,871 1,732,571,871 4 854,452,000 948,713,925 948,713,925 5 6,439,890 8,318,800 8,318,800 6 3,004,879,431 775,539,146 775,539,146 4,250,215,591 5,148,848,210 5,148,848,210 7 537,762,578 741,532,520 741,532,520 8 1,136,062,449 1,377,420,333 1,377,420,333 9 1,333,509,244 1,252,890,642 1,252,890,642 10 795,695,487 895,793,743 895,793,743 11 447,185,833 881,210,972 881,210,972 8,115,986,912 6,881,420,081 6,881,420,081 in Particulars ASSETS Non-Current Assets: Property, Plant & Equipment Intangible Assets Capital work-in-progress Current Assets: Inventories Trade & Other Receivables Advance, Deposits & Prepayments Advance Income Tax Cash and Cash Equivalents Total Assets: EQUITY & LIABILITIES Shareholders Equity: Share Capital General Reserve Revaluation Reserve Retained Earnings Non Current Liabilities: Long Term Borrowings Gratuity Payable Deferred Tax Liability Current Liabilities: Short Term Borrowings Long Term Borrowings-Current Portion Payable for Other Expenses Income Tax provision Trade Payables Payable for Other Finance Provision for WPPF Advance Received against Sales Total Equity & Liabilities: NET ASSETS VALUE PER SHARE (TK) 12 13 14 15 16 17 18 821,359,449 247,504,400 166,000,000 39,488,741 368,366,308 2,006,134,624 1,781,502,433 136,317,660 88,314,531 5,288,492,839 3,594,858,182 187,951,059 322,891,482 110,456,493 847,046,178 117,560,996 6,009,164 101,719,284 8,115,986,912 749,155,496 225,004,000 166,000,000 42,102,000 316,049,496 1,452,496,235 1,245,817,868 106,495,860 100,182,507 4,679,768,351 3,116,918,132 25,156,964 214,270,225 305,048,121 742,096,124 123,091,026 5,430,171 147,757,587 6,881,420,081 862,433,367 225,004,000 166,000,000 31,602,353 439,827,014 1,452,496,235 1,245,817,868 106,495,860 100,182,507 4,665,822,053 3,116,918,132 25,156,964 214,270,225 291,101,824 742,096,124 123,091,026 5,430,171 147,757,587 6,881,420,081 19 20 21 22 23 24 25 26 33.19 30.27 34.85 + 3.1. Calculate and interpret their Asset Quality Index (AQI) for 2019. Limit your interpretation/discussion strictly within 100 words. You can write less than 100 words, but not more. Numbers typed for showing steps of calculation are not part of word count 10 marks 3.2. Calculate and interpret their leverage index for 2019. Limit your interpretation/discussion strictly within 100 words. You can write less than 100 words, but not more. Numbers typed for showing steps of calculation are not part of word count. 10 marks


