

Answered step by step
Verified Expert Solution
Question
1 Approved Answer
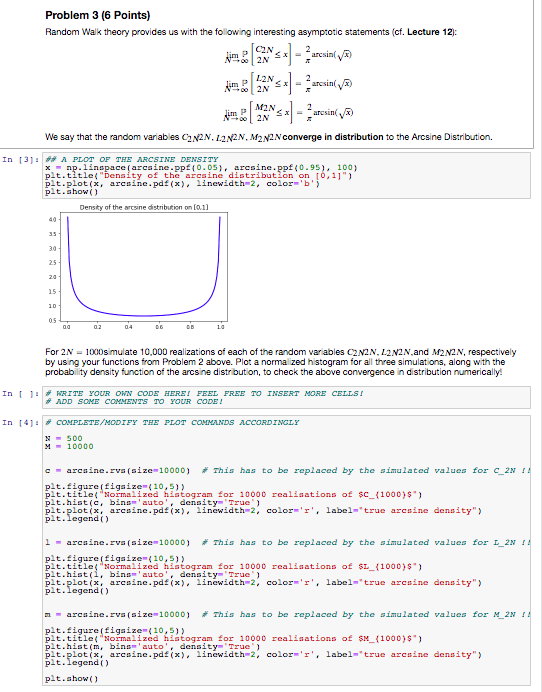
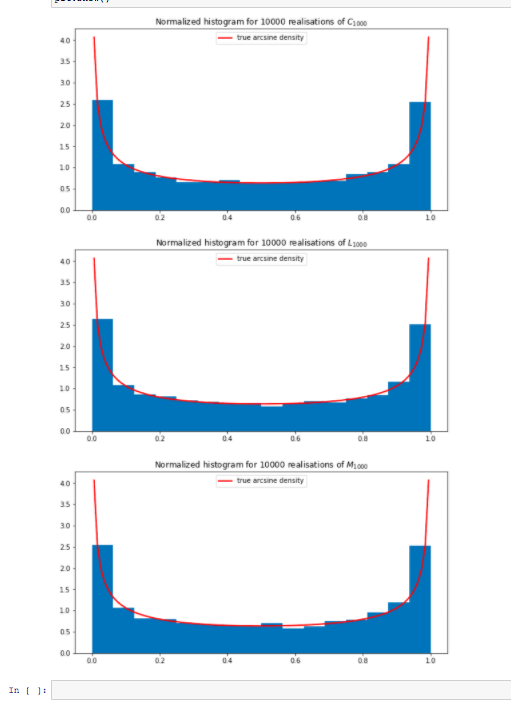
Problem 3 (6 Points) Random Walk theory provides us with the following interesting asymptotic statements (cf. Lecture 12): lim P CN 2 x - 2arcsin(
Step by Step Solution
There are 3 Steps involved in it
Step: 1

Get Instant Access to Expert-Tailored Solutions
See step-by-step solutions with expert insights and AI powered tools for academic success
Step: 2

Step: 3
Ace Your Homework with AI
Get the answers you need in no time with our AI-driven, step-by-step assistance
Get Started
Microsoft Dynamics 365 Core Finance And Operations Exams And Practice Tests Exam Study Guide For Microsoft Mb 300
Authors: Exam Library
1st Edition
979-8858858331