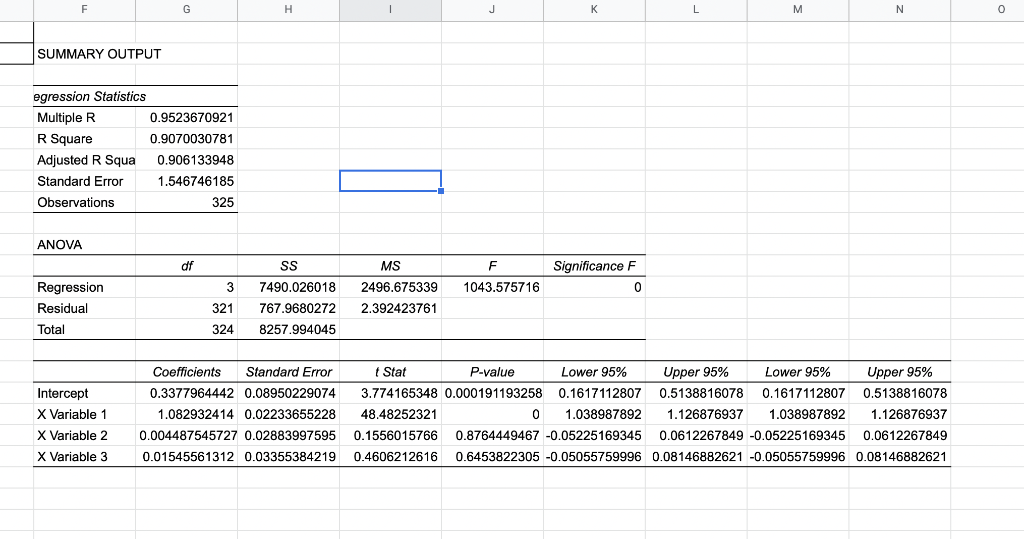
Problem 3 (A Real Data Application). Recall in the simple linear regression model in Module 3, I gave a real data example using the Nobel-winning Capital Asset Pricing Model (CAPM). In that example, we obtained R2=0.108, or 10.8%, which is a small value way less than 100%. This means that the single independent variable, the market return, RM, does not explain the return of an individual stock or portfolio very well in this simple linear regression model. Researchers have been developing new methodologies to add other independent variables to better capture the relationship between returns of an individual asset and the measures of these independent variables. Fama and French (1992) develop a three-factor model by adding two other variables on the basis of the CAPM. The model is in a form of: where R is the returns of an individual financial asset (i.e. a stock or a portfolio), RM is the market return (such as the S\&P 500 's return as we used in the CAPM), SMB is the Small (market capitalization) Minus Big, and the HML is the High (book-to-market ratio) Minus Low. Here RM,SMB, and HML are the three factors. This is a typical multiple linear regression model. This three-factor model can be used in the mutual fund industry to explain the return of an individual asset by the three factors. I have uploaded one real data set in EXCEL into the Homework Assignment#4 area in Canvas. Please download the data file to work on the following question. In the file, we look at a famous mutual fund called Fidelity Megellan fund. It is a monthly data spanning from January of 1979 to January of 2006. Question: Using EXCEL, please run the estimation procedure for the above-mentioned three-factor model, and illustrate your findings/comments based on the estimation of the model. Please specially pay attention to the R2(35 points). Please attach your EXCEL file for the model estimation results. Problem 3 (A Real Data Application). Recall in the simple linear regression model in Module 3, I gave a real data example using the Nobel-winning Capital Asset Pricing Model (CAPM). In that example, we obtained R2=0.108, or 10.8%, which is a small value way less than 100%. This means that the single independent variable, the market return, RM, does not explain the return of an individual stock or portfolio very well in this simple linear regression model. Researchers have been developing new methodologies to add other independent variables to better capture the relationship between returns of an individual asset and the measures of these independent variables. Fama and French (1992) develop a three-factor model by adding two other variables on the basis of the CAPM. The model is in a form of: where R is the returns of an individual financial asset (i.e. a stock or a portfolio), RM is the market return (such as the S\&P 500 's return as we used in the CAPM), SMB is the Small (market capitalization) Minus Big, and the HML is the High (book-to-market ratio) Minus Low. Here RM,SMB, and HML are the three factors. This is a typical multiple linear regression model. This three-factor model can be used in the mutual fund industry to explain the return of an individual asset by the three factors. I have uploaded one real data set in EXCEL into the Homework Assignment#4 area in Canvas. Please download the data file to work on the following question. In the file, we look at a famous mutual fund called Fidelity Megellan fund. It is a monthly data spanning from January of 1979 to January of 2006. Question: Using EXCEL, please run the estimation procedure for the above-mentioned three-factor model, and illustrate your findings/comments based on the estimation of the model. Please specially pay attention to the R2(35 points). Please attach your EXCEL file for the model estimation results