Answered step by step
Verified Expert Solution
Question
1 Approved Answer
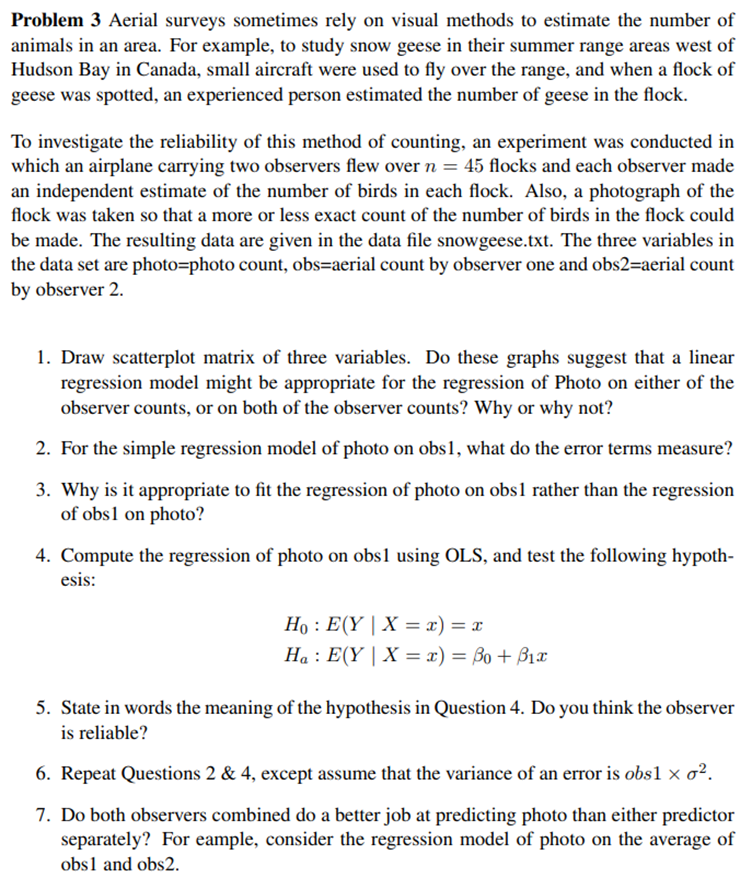
Problem 3 Aerial surveys sometimes rely on visual methods to estimate the number of animals in an area. For example, to study snow geese

Problem 3 Aerial surveys sometimes rely on visual methods to estimate the number of animals in an area. For example, to study snow geese in their summer range areas west of Hudson Bay in Canada, small aircraft were used to fly over the range, and when a flock of geese was spotted, an experienced person estimated the number of geese in the flock. To investigate the reliability of this method of counting, an experiment was conducted in which an airplane carrying two observers flew over n = 45 flocks and each observer made an independent estimate of the number of birds in each flock. Also, a photograph of the flock was taken so that a more or less exact count of the number of birds in the flock could be made. The resulting data are given in the data file snowgeese.txt. The three variables in the data set are photo-photo count, obs-aerial count by observer one and obs2-aerial count by observer 2. 1. Draw scatterplot matrix of three variables. Do these graphs suggest that a linear regression model might be appropriate for the regression of Photo on either of the observer counts, or on both of the observer counts? Why or why not? 2. For the simple regression model of photo on obs1, what do the error terms measure? 3. Why is it appropriate to fit the regression of photo on obs1 rather than the regression of obs1 on photo? 4. Compute the regression of photo on obs1 using OLS, and test the following hypoth- esis: Ho: E(Y | X = x) = x Ha E(Y | X = x) = + x 5. State in words the meaning of the hypothesis in Question 4. Do you think the observer is reliable? 6. Repeat Questions 2 & 4, except assume that the variance of an error is obs1 x . 7. Do both observers combined do a better job at predicting photo than either predictor separately? For eample, consider the regression model of photo on the average of obs1 and obs2.
Step by Step Solution
★★★★★
3.29 Rating (161 Votes )
There are 3 Steps involved in it
Step: 1
1 The scatterplot matrix suggests that a linear regression model might be appropriate for regressing ...
Get Instant Access to Expert-Tailored Solutions
See step-by-step solutions with expert insights and AI powered tools for academic success
Step: 2

Step: 3

Ace Your Homework with AI
Get the answers you need in no time with our AI-driven, step-by-step assistance
Get Started


