

Answered step by step
Verified Expert Solution
Question
1 Approved Answer
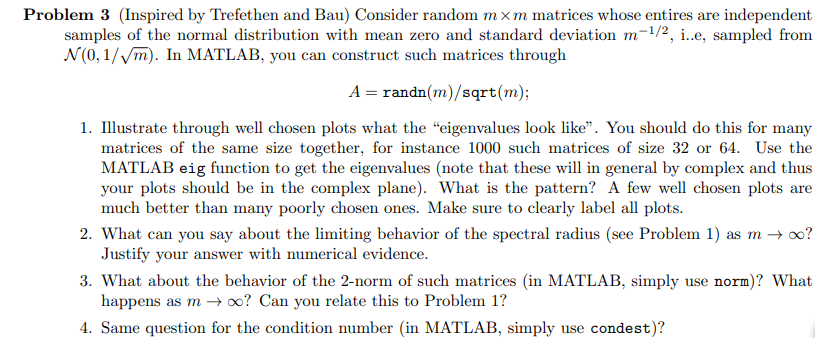
Problem 3 (Inspired by Trefethen and Bau) Consider random mxm matrices whose entires are independent samples of the normal distribution with mean zero and standard
Step by Step Solution
There are 3 Steps involved in it
Step: 1

Get Instant Access to Expert-Tailored Solutions
See step-by-step solutions with expert insights and AI powered tools for academic success
Step: 2

Step: 3
Ace Your Homework with AI
Get the answers you need in no time with our AI-driven, step-by-step assistance
Get Started
Data Infrastructure For Medical Research In Databases
Authors: Thomas Heinis ,Anastasia Ailamaki
1st Edition
1680833480, 978-1680833485