Answered step by step
Verified Expert Solution
Question
1 Approved Answer
Problem 4 (20 points): A consulting firm, Omega Consulting, is considering offering a data analysis service. If the demand is high (i.e., there is

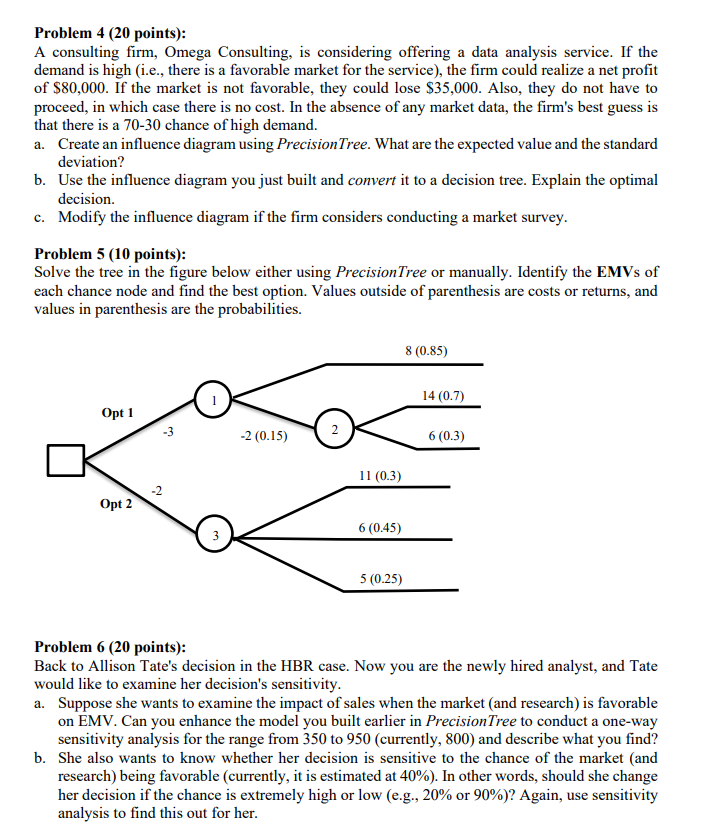
Problem 4 (20 points): A consulting firm, Omega Consulting, is considering offering a data analysis service. If the demand is high (i.e., there is a favorable market for the service), the firm could realize a net profit of $80,000. If the market is not favorable, they could lose $35,000. Also, they do not have to proceed, in which case there is no cost. In the absence of any market data, the firm's best guess is that there is a 70-30 chance of high demand. a. Create an influence diagram using Precision Tree. What are the expected value and the standard deviation? b. Use the influence diagram you just built and convert it to a decision tree. Explain the optimal decision. c. Modify the influence diagram if the firm considers conducting a market survey. Problem 5 (10 points): Solve the tree in the figure below either using Precision Tree or manually. Identify the EMVs of each chance node and find the best option. Values outside of parenthesis are costs or returns, and values in parenthesis are the probabilities. Opt 1 Opt 2 2 -2 (0.15) 2 11 (0.3) 6 (0.45) 5 (0.25) 8 (0.85) 14 (0.7) 6 (0.3) Problem 6 (20 points): Back to Allison Tate's decision in the HBR case. Now you are the newly hired analyst, and Tate would like to examine her decision's sensitivity. a. Suppose she wants to examine the impact of sales when the market (and research) is favorable on EMV. Can you enhance the model you built earlier in Precision Tree to conduct a one-way sensitivity analysis for the range from 350 to 950 (currently, 800) and describe what you find? b. She also wants to know whether her decision is sensitive to the chance of the market (and research) being favorable (currently, it is estimated at 40% ). In other words, should she change her decision if the chance is extremely high or low (e.g., 20% or 90%)? Again, use sensitivity analysis to find this out for her.
Step by Step Solution
★★★★★
3.46 Rating (162 Votes )
There are 3 Steps involved in it
Step: 1
Problem 4 a Influence Diagram using PrecisionTree Node 1 Decision Node Proceed or Not Proceed Node 2 ...
Get Instant Access to Expert-Tailored Solutions
See step-by-step solutions with expert insights and AI powered tools for academic success
Step: 2

Step: 3

Ace Your Homework with AI
Get the answers you need in no time with our AI-driven, step-by-step assistance
Get Started


