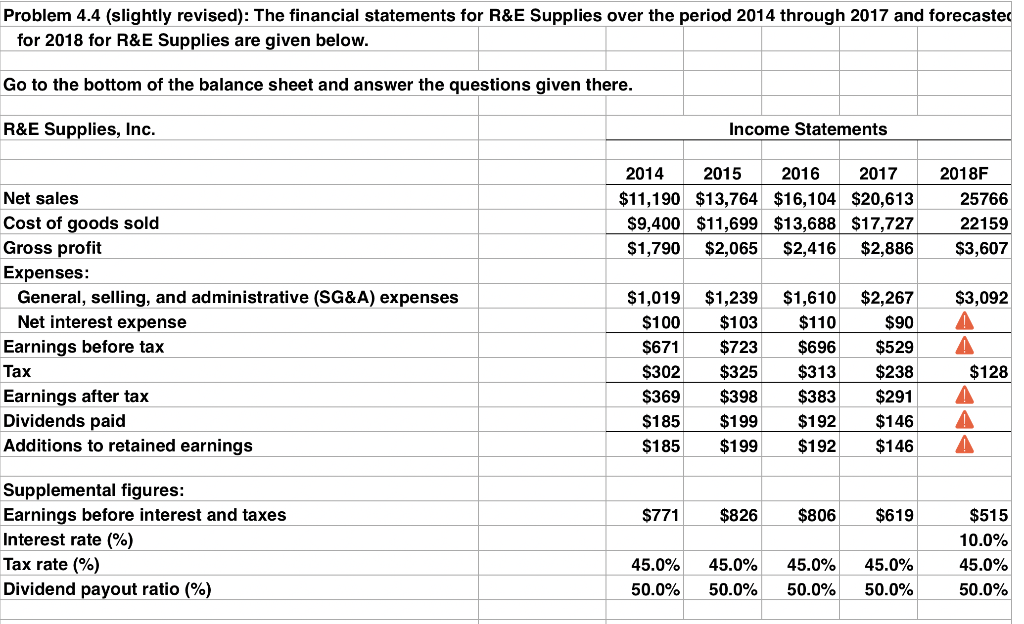
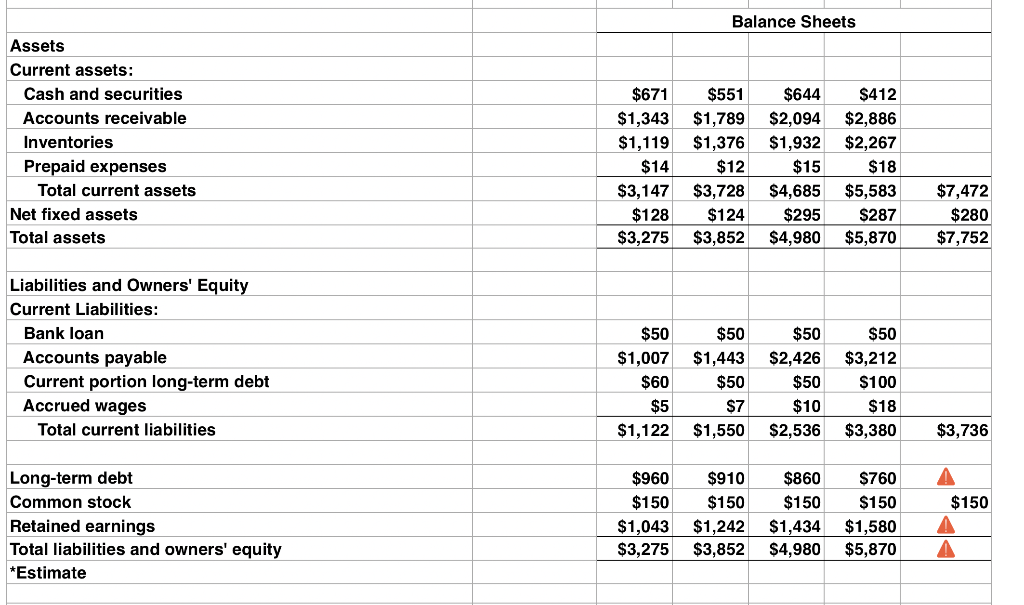
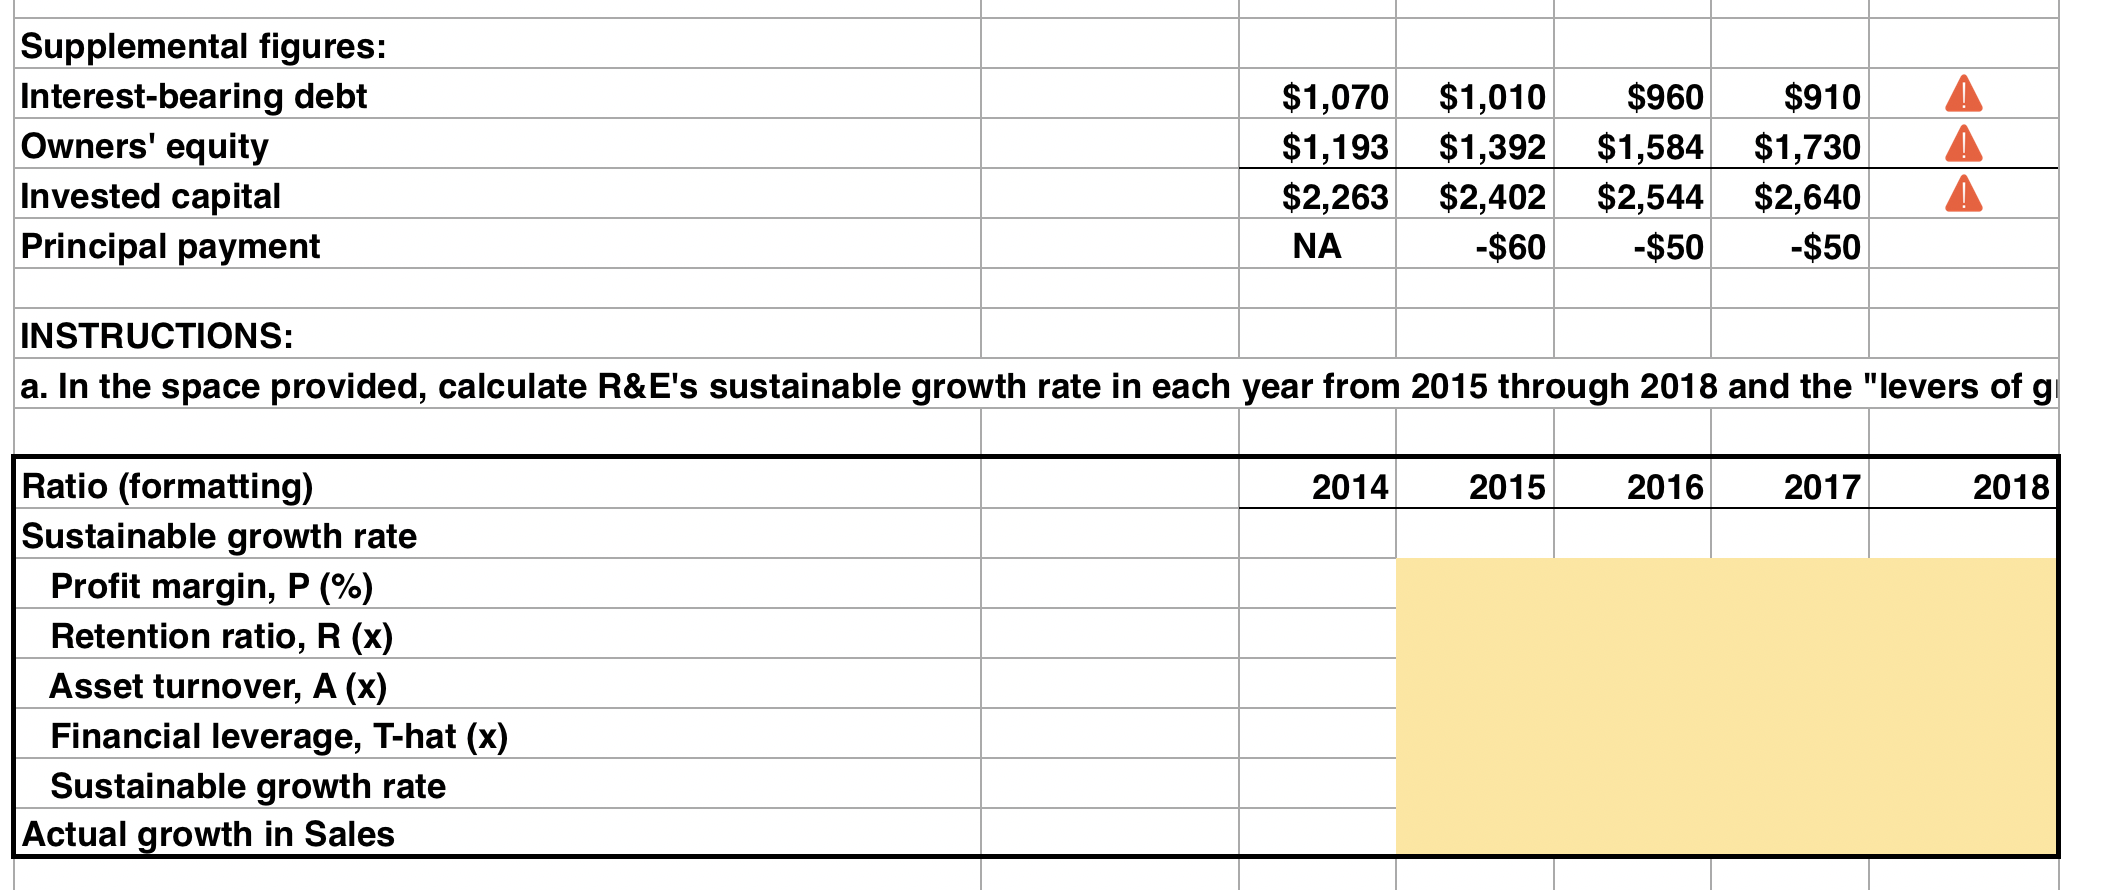
Problem 4.4 (slightly revised): The financial statements for R&E Supplies over the period 2014 through 2017 and forecaster for 2018 for R&E Supplies are given below. Go to the bottom of the balance sheet and answer the questions given there. R&E Supplies, Inc. Income Statements 2014 2015 2016 2017 $11,190 $13,764 $16,104 $20,613 $9,400 $11,699 $13,688 $17,727 $1,790 $2,065 $2,416 $2,886 2018F 25766 22159 $3,607 $3,092 Net sales Cost of goods sold Gross profit Expenses: General, selling, and administrative (SG&A) expenses Net interest expense Earnings before tax Tax Earnings after tax Dividends paid Additions to retained earnings $1,019 $100 $671 $302 $369 $185 $185 $1,239 $103 $723 $325 $398 $1,610 $110 $696 $313 $383 $2,267 $90 $529 $238 $291 $146 $146 $128 $199 $192 $199 $192 $771 $826 $806 $619 Supplemental figures: Earnings before interest and taxes Interest rate (%) Tax rate (%) Dividend payout ratio (%) $515 10.0% 45.0% 50.0% 45.0% 50.0% 45.0% 50.0% 45.0% 50.0% 45.0% 50.0% Balance Sheets Assets Current assets: Cash and securities Accounts receivable Inventories Prepaid expenses Total current assets Net fixed assets Total assets $671 $1,343 $1.19 $14 $3,147 $128 $3,275 $551 $1,789 $1,376 $12 $3,728 $124 $3,852 $644 $2,094 $1,932 $15 $4,685 $295 $4,980 $412 $2,886 $2,267 $18 $5,583 $287 $5,870 $7,472 $280 $7,752 Liabilities and Owners' Equity Current Liabilities: Bank loan Accounts payable Current portion long-term debt Accrued wages Total current liabilities $50 $1,007 $60 $5 $1,122 $50 $1,443 $50 $7 $1,550 $50 $2,426 $50 $10 $2,536 $50 | $3,212 $100 $18 $3,380 $3,736 $150 Long-term debt Common stock Retained earnings Total liabilities and owners' equity *Estimate $g60 $150 $1.043 $3,275 $90 $150 $1.242 $3,852 $360 $150 $1.434 $4,980 $760 $150 | $1.580 $5,870 Supplemental figures: Interest-bearing debt Owners' equity Invested capital Principal payment $1,070 $1,193 $2,263 NA $1,010 $1,392 $2,402 -$60 $960 $1,584 $2,544 -$50 $910 $1,730 $2,640 -$50 INSTRUCTIONS: a. In the space provided, calculate R&E's sustainable growth rate in each year from 2015 through 2018 and the "levers of gi 2014 2015 2016 2017 2018 Ratio (formatting) Sustainable growth rate Profit margin, P (%) Retention ratio, R (x) Asset turnover, A (x) Financial leverage, T-hat (x) Sustainable growth rate Actual growth in Sales b. Comparing the company's sustainable growth rate with its actual and projected (for 2018) growth rates in sales over these years, what growth management problems does R&E appear to face over this period? c. How did the company cope with these problems? Do you see any difficulties with the way it addressed its growth problems over this period? If so, what are they? d. What advice would you offer management regarding managing future growth? Problem 4.4 (slightly revised): The financial statements for R&E Supplies over the period 2014 through 2017 and forecaster for 2018 for R&E Supplies are given below. Go to the bottom of the balance sheet and answer the questions given there. R&E Supplies, Inc. Income Statements 2014 2015 2016 2017 $11,190 $13,764 $16,104 $20,613 $9,400 $11,699 $13,688 $17,727 $1,790 $2,065 $2,416 $2,886 2018F 25766 22159 $3,607 $3,092 Net sales Cost of goods sold Gross profit Expenses: General, selling, and administrative (SG&A) expenses Net interest expense Earnings before tax Tax Earnings after tax Dividends paid Additions to retained earnings $1,019 $100 $671 $302 $369 $185 $185 $1,239 $103 $723 $325 $398 $1,610 $110 $696 $313 $383 $2,267 $90 $529 $238 $291 $146 $146 $128 $199 $192 $199 $192 $771 $826 $806 $619 Supplemental figures: Earnings before interest and taxes Interest rate (%) Tax rate (%) Dividend payout ratio (%) $515 10.0% 45.0% 50.0% 45.0% 50.0% 45.0% 50.0% 45.0% 50.0% 45.0% 50.0% Balance Sheets Assets Current assets: Cash and securities Accounts receivable Inventories Prepaid expenses Total current assets Net fixed assets Total assets $671 $1,343 $1.19 $14 $3,147 $128 $3,275 $551 $1,789 $1,376 $12 $3,728 $124 $3,852 $644 $2,094 $1,932 $15 $4,685 $295 $4,980 $412 $2,886 $2,267 $18 $5,583 $287 $5,870 $7,472 $280 $7,752 Liabilities and Owners' Equity Current Liabilities: Bank loan Accounts payable Current portion long-term debt Accrued wages Total current liabilities $50 $1,007 $60 $5 $1,122 $50 $1,443 $50 $7 $1,550 $50 $2,426 $50 $10 $2,536 $50 | $3,212 $100 $18 $3,380 $3,736 $150 Long-term debt Common stock Retained earnings Total liabilities and owners' equity *Estimate $g60 $150 $1.043 $3,275 $90 $150 $1.242 $3,852 $360 $150 $1.434 $4,980 $760 $150 | $1.580 $5,870 Supplemental figures: Interest-bearing debt Owners' equity Invested capital Principal payment $1,070 $1,193 $2,263 NA $1,010 $1,392 $2,402 -$60 $960 $1,584 $2,544 -$50 $910 $1,730 $2,640 -$50 INSTRUCTIONS: a. In the space provided, calculate R&E's sustainable growth rate in each year from 2015 through 2018 and the "levers of gi 2014 2015 2016 2017 2018 Ratio (formatting) Sustainable growth rate Profit margin, P (%) Retention ratio, R (x) Asset turnover, A (x) Financial leverage, T-hat (x) Sustainable growth rate Actual growth in Sales b. Comparing the company's sustainable growth rate with its actual and projected (for 2018) growth rates in sales over these years, what growth management problems does R&E appear to face over this period? c. How did the company cope with these problems? Do you see any difficulties with the way it addressed its growth problems over this period? If so, what are they? d. What advice would you offer management regarding managing future growth