Answered step by step
Verified Expert Solution
Question
1 Approved Answer
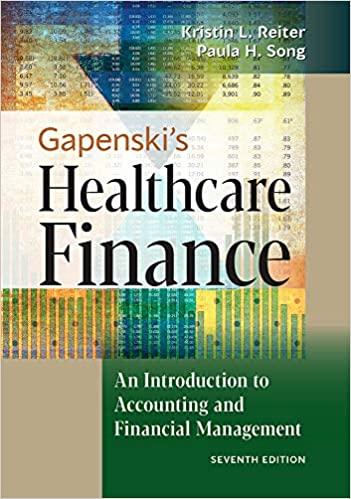
Problem 4.6 from page 142, Chapter 4 Problem 17.4 from page 639 and 640, Chapter 17 Problem 4.6 from page 142, Chapter 4 1. How
Problem 4.6 from page 142, Chapter 4
Problem 17.4 from page 639 and 640, Chapter 17
 Problem 4.6 from page 142, Chapter 4 1. How does this balance sheet differ from the ones presented in Exhibit 4.1 and Problem 4.5? 2. What is Green Valley's net working capital for 2011? 3. What is Green Valley's debt ratio? How does it compare with the debt ratios for Sunnyvale and BestCare? Consider the following financial statement for BestCare HMO, a not-for=profit managed care plan. Problem 17.4 from pages 639-640, Chapter 17 1. Perform a Du Pont analysis on BestCare. Assume that the industry average ratios are as follows. Total margin 3.8%. Total assest turnover 2.1 Equity multiplier 3.2 Return on equity (ROE) 25.5% 2. Calculate and interpret the following ratios for BestCare: Industry Average Return on assets (ROA) 8.0% Current ratio 1.3 Days cash on hand 41 days Average collection period 7days Debt ratio 69% Debt -to-equity ratio 2.2 Times interest earned (TIE) ratio 2.8 Fixed asset turnover ratio 5.2
 Step by Step Solution
There are 3 Steps involved in it
Step: 1

Get Instant Access to Expert-Tailored Solutions
See step-by-step solutions with expert insights and AI powered tools for academic success
Step: 2

Step: 3

Ace Your Homework with AI
Get the answers you need in no time with our AI-driven, step-by-step assistance
Get Started


