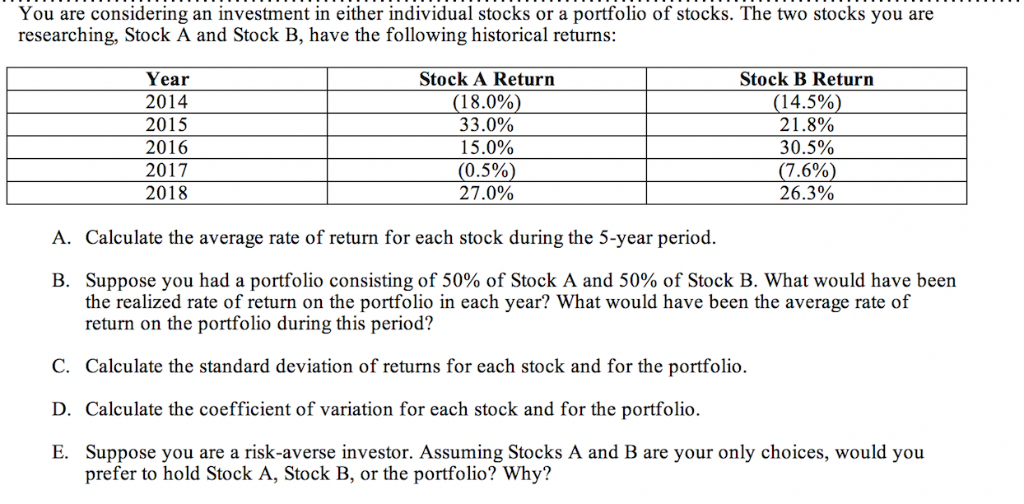

Problem 5 Problem is on following page, hints are presented below: Part A since we are dealing with historical data, the average rate of return for each stock is just a simple average over the five years of data. Part B you want to add a third column of data to the Stock A and Stock B data that shows a portfolio of 50% Stock A and 50% Stock B; then you need to calculate the expected return for the portfolio for each of the five years (separately) based on the 50-50 weight. Then, calculate the average portfolio return over the five-year period, just as you did for the individual stocks Part C At this point, you should have three columns of data (Stock A, Stock B, and a 50-50 portfolio), with an average return for each. Based on this data, you want to calculate the standard deviation for each column of data separately. Note: since you are dealing with historical data, you will use Formula 8.3a. Part D The heavy lifting is now done; if you have the average (or expected) return for each stock and the portfolio, and you have the standard deviation for each, you can now solve for the Coefficient of Variation for each Part E Base this response on your answers to Part D. Note - since the correlation coefficient (not required) is so high between Stock A and Stock B (I calculated this at .876), there is not a huge benefit to diversification, but you will see some minimal benefit. You are considering an investment in either individual stocks or a portfolio of stocks. The two stocks you are researching, Stock A and Stock B, have the following historical returns: Stock A Return Stock B Return Year (14.5% 21.8% 2014 (18.0%) 33.0% 2015 2016 15.0% 30.5% 2017 (0.5%) 27.0% (7.6%) 26.3% 2018 A. Calculate the average rate of return for each stock during the 5-year period. B. Suppose you had a portfolio consisting of 50% of Stock A and 50% of Stock B. What would have been the realized rate of return on the portfolio in each year? What would have been the average rate of return on the portfolio during this period? C. Calculate the standard deviation of returns for each stock and for the portfolio D. Calculate the coefficient of variation for each stock and for the portfolio. E. Suppose you are a risk-averse investor. Assuming Stocks A and B are your only choices, would you prefer to hold Stock A, Stock B, or the portfolio? Why


