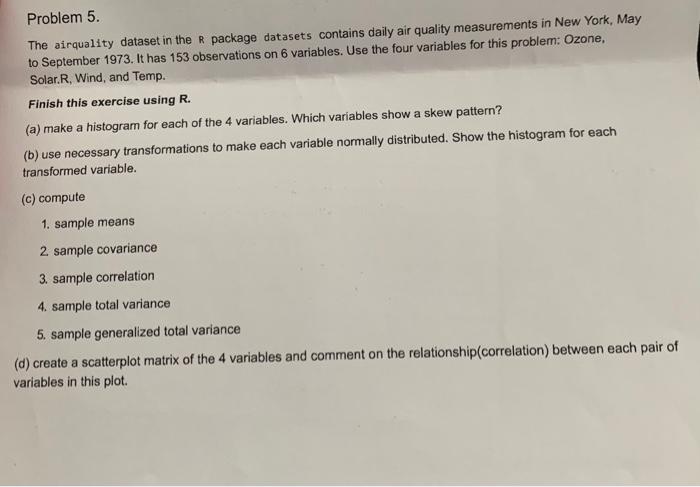
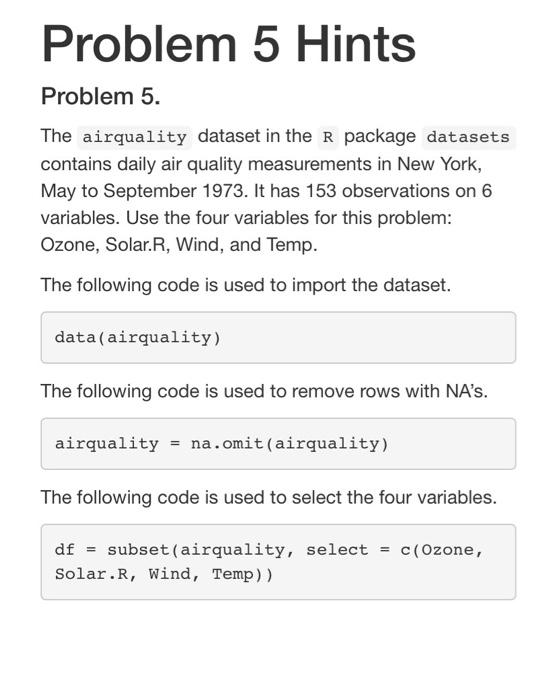
Problem 5. The airquality dataset in the R package datasets contains daily air quality measurements in New York, May to September 1973. It has 153 observations on 6 variables. Use the four variables for this problem: Ozone, Solar.R, Wind, and Temp. Finish this exercise using R. (a) make a histogram for each of the 4 variables. Which variables show a skew pattern? (b) use necessary transformations to make each variable normally distributed. Show the histogram for each transformed variable. (c) compute 1. sample means 2 sample covariance 3. sample correlation 4. sample total variance 5. sample generalized total variance (d) create a scatterplot matrix of the 4 variables and comment on the relationship(correlation) between each pair of variables in this plot. Problem 5 Hints . Problem 5. The airquality dataset in the R package datasets contains daily air quality measurements in New York, May to September 1973. It has 153 observations on 6 variables. Use the four variables for this problem: Ozone, Solar.R, Wind, and Temp. The following code is used to import the dataset. data(airquality) The following code is used to remove rows with NA's. airquality na.omit(airquality) The following code is used to select the four variables. df = subset(airquality, select = c(Ozone, Solar.R, Wind, Temp)) Problem 5. The airquality dataset in the R package datasets contains daily air quality measurements in New York, May to September 1973. It has 153 observations on 6 variables. Use the four variables for this problem: Ozone, Solar.R, Wind, and Temp. Finish this exercise using R. (a) make a histogram for each of the 4 variables. Which variables show a skew pattern? (b) use necessary transformations to make each variable normally distributed. Show the histogram for each transformed variable. (c) compute 1. sample means 2 sample covariance 3. sample correlation 4. sample total variance 5. sample generalized total variance (d) create a scatterplot matrix of the 4 variables and comment on the relationship(correlation) between each pair of variables in this plot. Problem 5 Hints . Problem 5. The airquality dataset in the R package datasets contains daily air quality measurements in New York, May to September 1973. It has 153 observations on 6 variables. Use the four variables for this problem: Ozone, Solar.R, Wind, and Temp. The following code is used to import the dataset. data(airquality) The following code is used to remove rows with NA's. airquality na.omit(airquality) The following code is used to select the four variables. df = subset(airquality, select = c(Ozone, Solar.R, Wind, Temp))


