Problem 5-3 Parts a, b & c
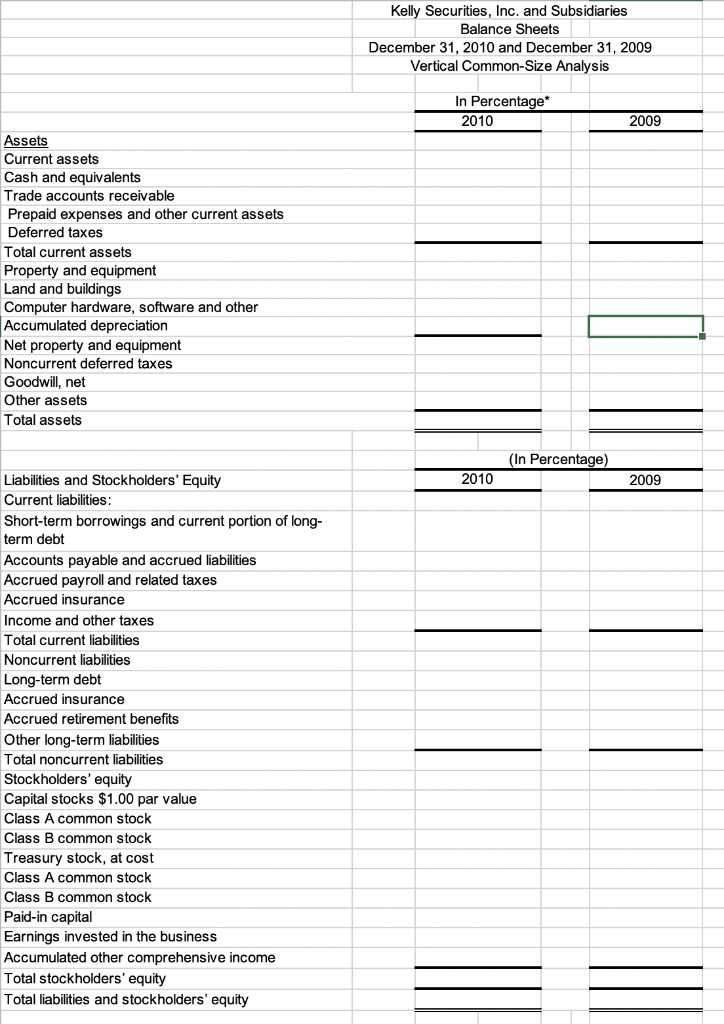
If possible vertical analysis should be something that can be transferred into this
If possible horizontal analysis should be something that can be transferred into this
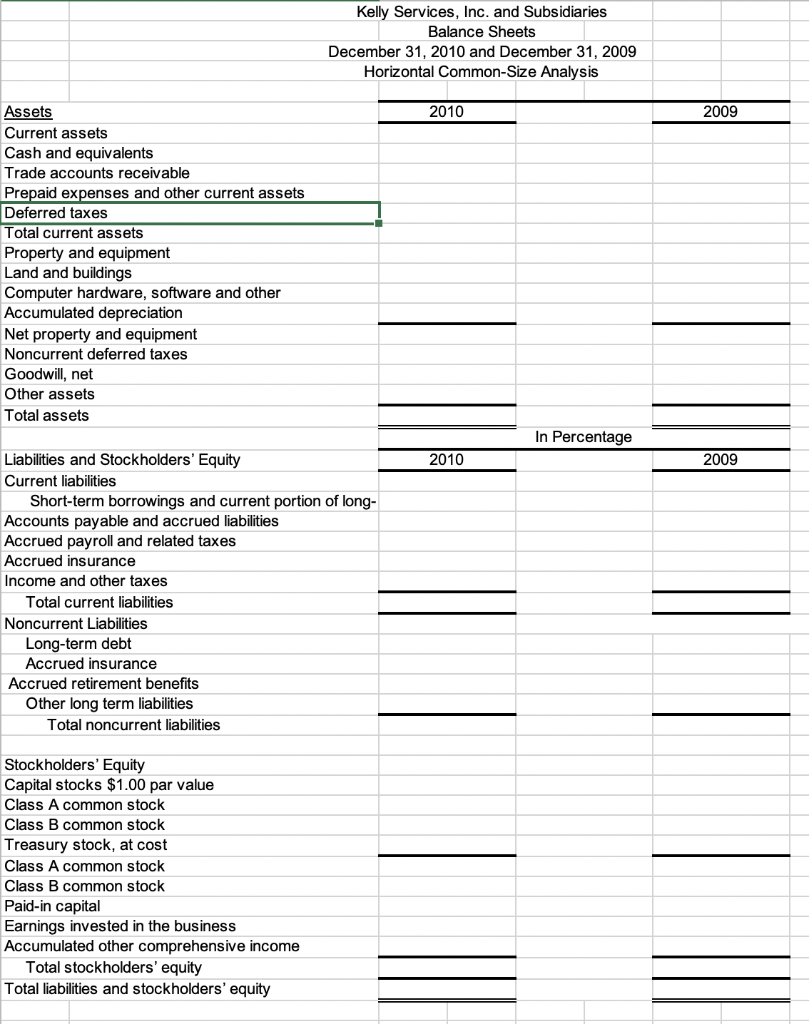
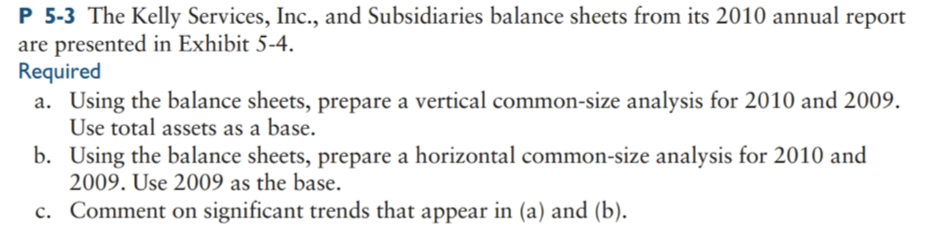
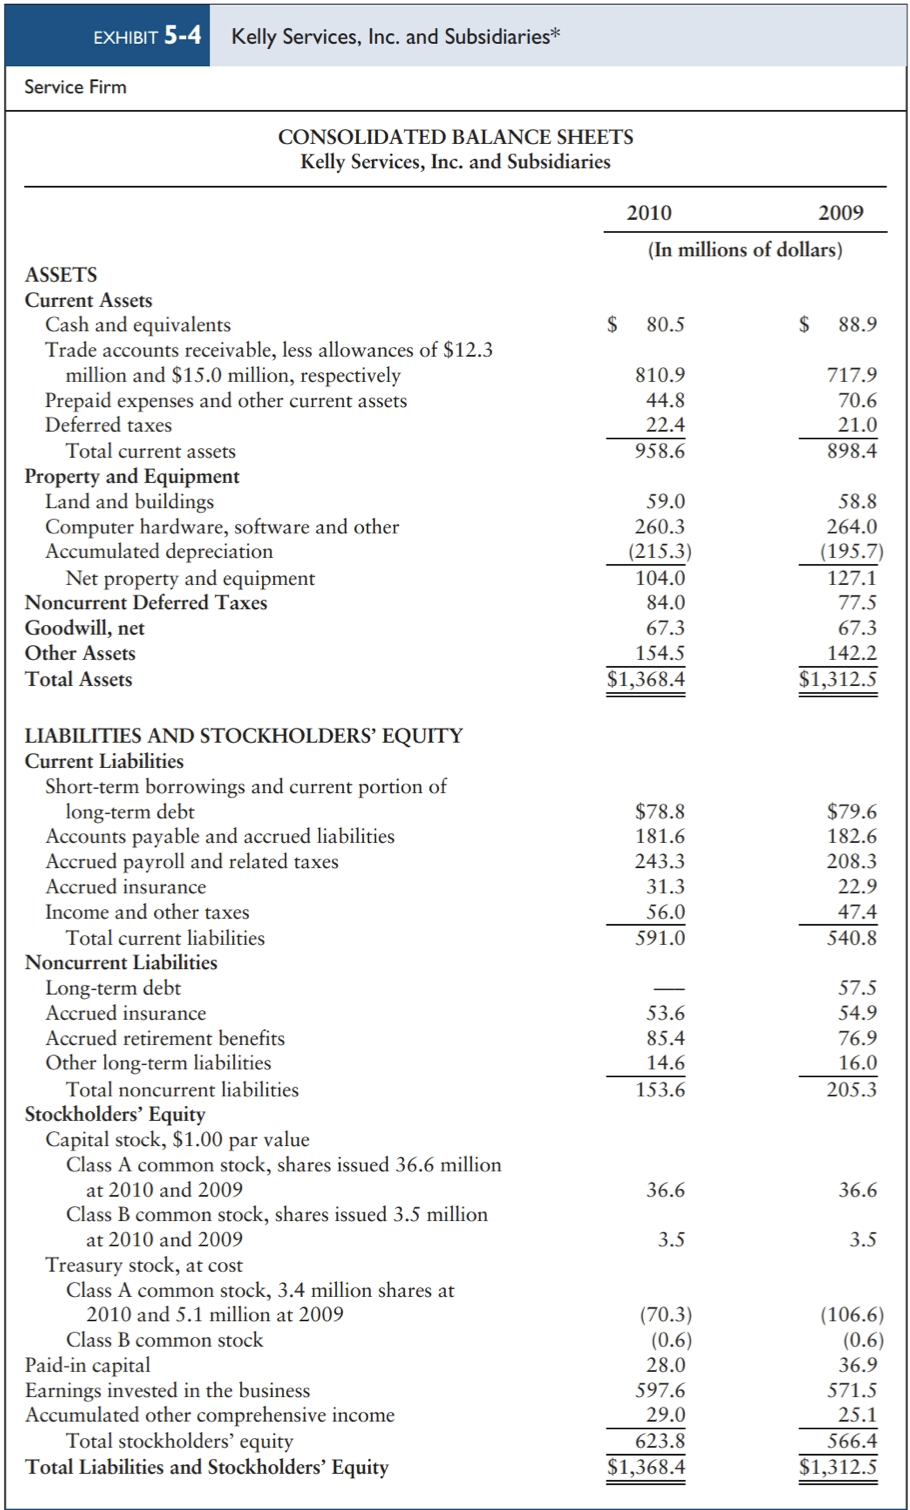
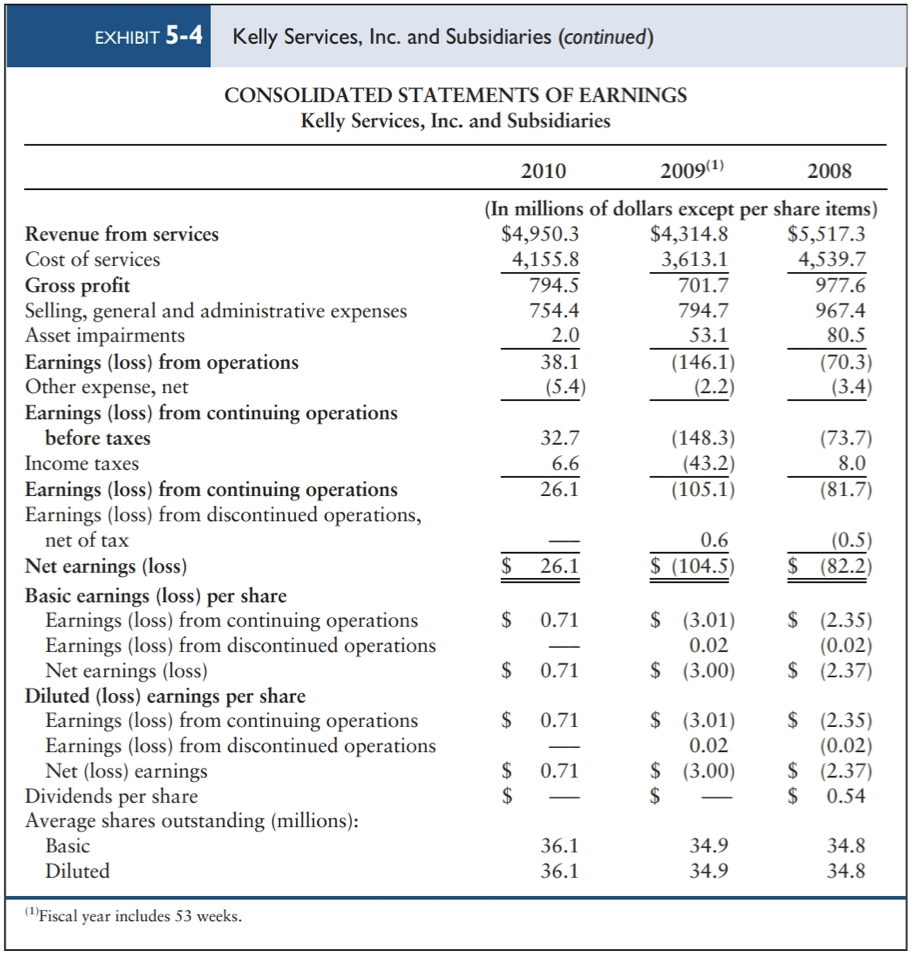
P 5-3 The Kelly Services, Inc., and Subsidiaries balance sheets from its 2010 annual report are presented in Exhibit 5-4. Required a. Using the balance sheets, prepare a vertical common-size analysis for 2010 and 2009. Use total assets as a base. b. Using the balance sheets, prepare a horizontal common-size analysis for 2010 and 2009. Use 2009 as the base. c. Comment on significant trends that appear in (a) and (b). EXHIBIT 5-4 Kelly Services, Inc. and Subsidiaries* Service Firm CONSOLIDATED BALANCE SHEETS Kelly Services, Inc. and Subsidiaries 2010 2009 (In millions of dollars) $ 80.5 $ 88.9 810.9 44.8 22.4 958.6 717.9 70.6 21.0 898.4 ASSETS Current Assets Cash and equivalents Trade accounts receivable, less allowances of $12.3 million and $15.0 million, respectively Prepaid expenses and other current assets Deferred taxes Total current assets Property and Equipment Land and buildings Computer hardware, software and other Accumulated depreciation Net property and equipment Noncurrent Deferred Taxes Goodwill, net Other Assets Total Assets 59.0 260.3 (215.3) 104.0 84.0 67.3 154.5 $1,368.4 58.8 264.0 (195.7 127.1 77.5 67.3 142.2 $1,312.5 $78.8 181.6 243.3 31.3 56.0 591.0 $79.6 182.6 208.3 22.9 47.4 540.8 53.6 85.4 14.6 153.6 57.5 54.9 76.9 16.0 205.3 LIABILITIES AND STOCKHOLDERS' EQUITY Current Liabilities Short-term borrowings and current portion of long-term debt Accounts payable and accrued liabilities Accrued payroll and related taxes Accrued insurance Income and other taxes Total current liabilities Noncurrent Liabilities Long-term debt Accrued insurance Accrued retirement benefits Other long-term liabilities Total noncurrent liabilities Stockholders' Equity Capital stock, $1.00 par value Class A common stock, shares issued 36.6 million at 2010 and 2009 Class B common stock, shares issued 3.5 million at 2010 and 2009 Treasury stock, at cost Class A common stock, 3.4 million shares at 2010 and 5.1 million at 2009 Class B common stock Paid-in capital Earnings invested in the business Accumulated other comprehensive income Total stockholders' equity Total Liabilities and Stockholders' Equity 36.6 36.6 3.5 3.5 (70.3) (0.6) 28.0 597.6 29.0 623.8 $1,368.4 (106.6) (0.6) 36.9 571.5 25.1 566.4 $1,312.5 EXHIBIT 5-4 Kelly Services, Inc. and Subsidiaries (continued) CONSOLIDATED STATEMENTS OF EARNINGS Kelly Services, Inc. and Subsidiaries 2010 2009(1) 2008 (In millions of dollars except per share items) $4,950.3 $4,314.8 $5,517.3 4,155.8 3,613.1 4,539.7 794.5 701.7 977.6 754.4 794.7 967.4 2.0 53.1 80.5 38.1 (146.1) (70.3) (5.4) (2.2) (3.4) 32.7 6.6 26.1 (148.3) (43.2) (105.1) (73.7) 8.0 (81.7) Revenue from services Cost of services Gross profit Selling, general and administrative expenses Asset impairments Earnings (loss) from operations Other expense, net Earnings (loss) from continuing operations before taxes Income taxes Earnings (loss) from continuing operations Earnings (loss) from discontinued operations, net of tax Net earnings (loss) Basic earnings (loss) per share Earnings (loss) from continuing operations Earnings (loss) from discontinued operations Net earnings (loss) Diluted (loss) earnings per share Earnings (loss) from continuing operations Earnings (loss) from discontinued operations Net (loss) earnings Dividends per share Average shares outstanding (millions): Basic Diluted 0.6 $ (104.5 (0.5) $ (82.2 $ 26.1 $ 0.71 $ (3.01) 0.02 $ (3.00) $ (2.35) (0.02) $ (2.37) $ 0.71 $ 0.71 $ (3.01) 0.02 $ (3.00) $ $ (2.35) (0.02) $ (2.37) $ 0.54 0.71 AA 36.1 36.1 34.9 34.9 34.8 34.8 (Fiscal year includes 53 weeks. Kelly Securities, Inc. and Subsidiaries Balance Sheets December 31, 2010 and December 31, 2009 Vertical Common-Size Analysis In Percentage* 2010 2009 Assets Current assets Cash and equivalents Trade accounts receivable Prepaid expenses and other current assets Deferred taxes Total current assets Property and equipment Land and buildings Computer hardware, software and other Accumulated depreciation Net property and equipment Noncurrent deferred taxes Goodwill, net Other assets Total assets (In Percentage) 2010 2009 Liabilities and Stockholders' Equity Current liabilities: Short-term borrowings and current portion of long- term debt Accounts payable and accrued liabilities Accrued payroll and related taxes Accrued insurance Income and other taxes Total current liabilities Noncurrent liabilities Long-term debt Accrued insurance Accrued retirement benefits Other long-term liabilities Total noncurrent liabilities Stockholders' equity Capital stocks $1.00 par value Class A common stock Class B common stock Treasury stock, at cost Class A common stock Class B common stock Paid-in capital Earnings invested the business Accumulated other comprehensive income Total stockholders' equity Total liabilities and stockholders' equity Kelly Services, Inc. and Subsidiaries Balance Sheets December 31, 2010 and December 31, 2009 Horizontal Common-Size Analysis 2010 2009 Assets Current assets Cash and equivalents Trade accounts receivable Prepaid expenses and other current assets Deferred taxes Total current assets Property and equipment Land and buildings Computer hardware, software and other Accumulated depreciation Net property and equipment Noncurrent deferred taxes Goodwill, net Other assets Total assets In Percentage 2010 2009 Liabilities and Stockholders' Equity Current liabilities Short-term borrowings and current portion of long- Accounts payable and accrued liabilities Accrued payroll and related taxes Accrued insurance Income and other taxes Total current liabilities Noncurrent Liabilities Long-term debt Accrued insurance Accrued retirement benefits Other long term liabilities Total noncurrent liabilities Stockholders' Equity Capital stocks $1.00 par value Class A common stock Class B common stock Treasury stock, at cost Class A common stock Class B common stock Paid-in capital Earnings invested in the business Accumulated other comprehensive income Total stockholders' equity Total liabilities and stockholders' equity