

Answered step by step
Verified Expert Solution
Question
1 Approved Answer
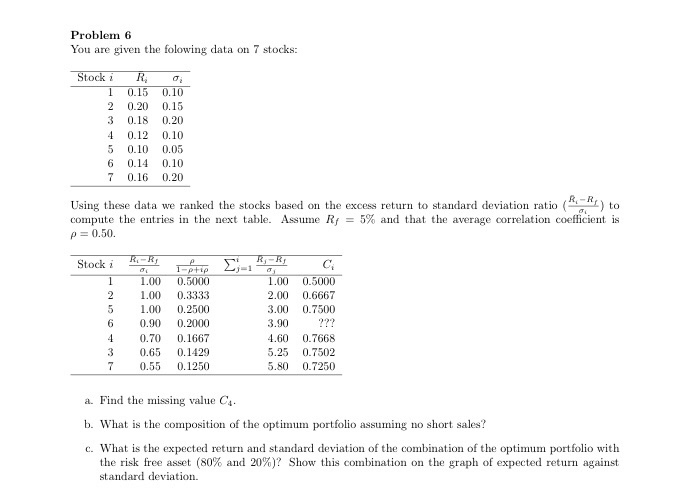
Problem 6 You are given the folowing data on 7 stocks: 0.10 2 0.20 0.15 3 0.18 0.20 4 0.12 0.10 5 0.10 0.05 6
Step by Step Solution
There are 3 Steps involved in it
Step: 1

Get Instant Access to Expert-Tailored Solutions
See step-by-step solutions with expert insights and AI powered tools for academic success
Step: 2

Step: 3
Ace Your Homework with AI
Get the answers you need in no time with our AI-driven, step-by-step assistance
Get Started
Regulation A+ How The JOBS Act Creates Opportunities For Entrepreneurs And Investors
Authors: Paul Getty , Dinesh Gupta , Robert R. Kaplan
1st Edition
1430257318,1430257326