

Answered step by step
Verified Expert Solution
Question
1 Approved Answer
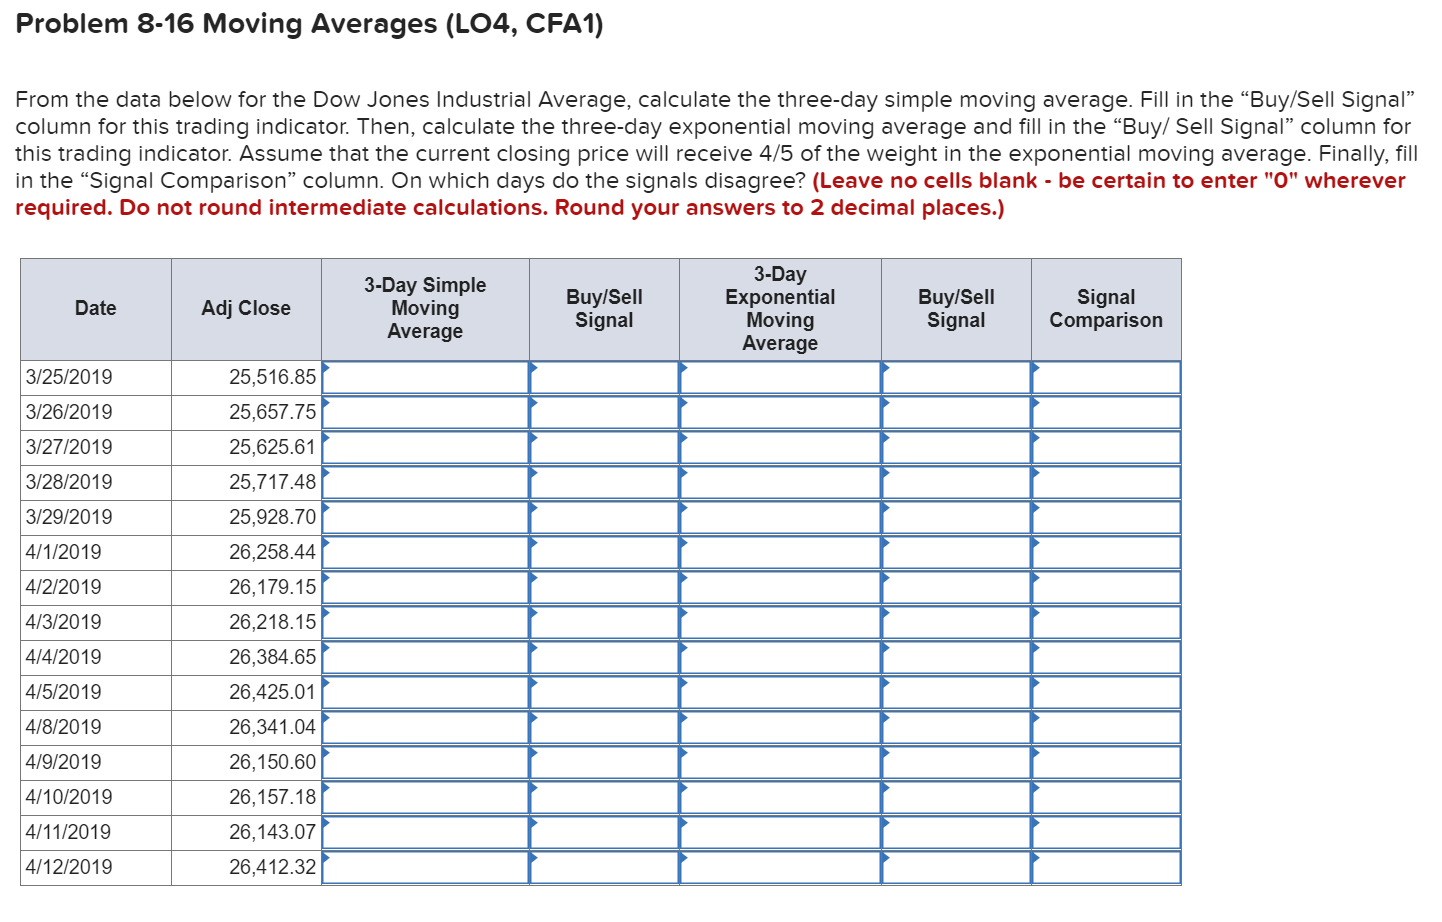
Problem 8-16 Moving Averages (LO4, CFA1) From the data below for the Dow Jones Industrial Average, calculate the three-day simple moving average. Fill in the
Step by Step Solution
There are 3 Steps involved in it
Step: 1

Get Instant Access to Expert-Tailored Solutions
See step-by-step solutions with expert insights and AI powered tools for academic success
Step: 2

Step: 3
Ace Your Homework with AI
Get the answers you need in no time with our AI-driven, step-by-step assistance
Get Started
Finance Ethics Critical Issues In Theory And Practice
Authors: John R. Boatright
1st Edition
0631214275, 978-0631214274