Question
Problem Assignment 1A: Creating the Spreadsheet for the Base Case A discussion of each spreadsheet section follows. The discussion explains how to set up each
Problem
Assignment 1A: Creating the Spreadsheet for the Base Case
A discussion of each spreadsheet section follows. The discussion explains how to set up each section and explains the logic of the formulas in the sections cells. You can enter the data yourself or use the base case spreadsheet skeleton to save time. To access the spreadsheet skeleton, select Case 9 in your data files, and then select AutoMakerProductMix.xlsx.
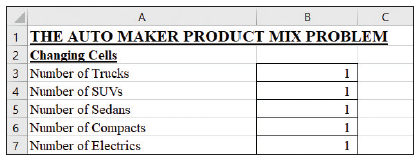
Changing Cells Section
Your spreadsheet should have the changing cells shown in Figure 9-4.

FIGURE 9-4 Changing Cells section
You will ask the Solver model to compute how many of each type of vehicle to make and sell five years from now, in order to meet the MPG standard and to maximize gross profit. Start with a value of 1 in each cell. Solver will change each value as it computes the answers. You do not want Solver to compute the fractional part of a vehicle. You can force Solver to recommend integer values when specifying the constraints.
Constants Section
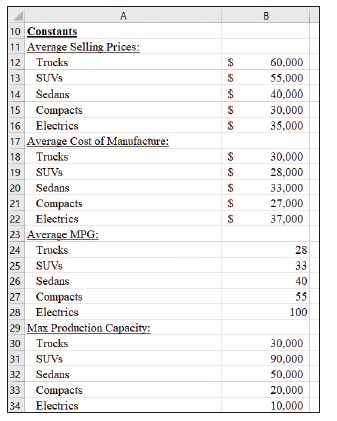
Your spreadsheet should have the constants shown in Figure 9-5. An explanation of the line items follows the figure.

FIGURE 9-5 Constants section
Average Selling PricesThe selling prices expected in five years are shown in Figure 9-1.
Average Cost of ManufactureThe costs of manufacture expected in five years are shown in Figure 9-1.
Average MPGThe expected MPGs for each type of vehicle are shown in Figure 9-3.
Max Production CapacityUpper limits on production are shown in Figure 9-2.
Calculations Section
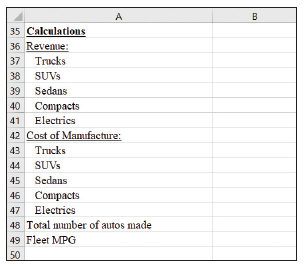
Your spreadsheet should calculate the amounts shown in Figure 9-6. An explanation of the line items follows the figure.

FIGURE 9-6 Calculations section
RevenueRevenues are a function of the number of vehicles made and sold and the expected selling price.
Cost of ManufactureCosts are a function of the number of vehicles made and sold and the expected cost of manufacture.
Total number of autos madeThis value is the sum of all the vehicles made and sold.
Fleet MPGThis value is the weighted average MPG of all the vehicles made and sold.
Income Statement Section
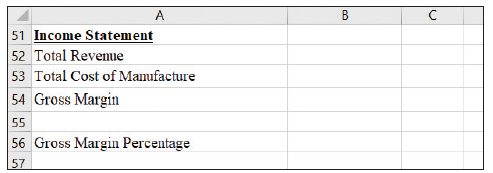
Your spreadsheet should calculate the gross margin, as shown in Figure 9-7. An explanation of the line items follows the figure.

FIGURE 9-7 Income Statement section
Total RevenueThis is the sum of the revenues for all vehicles. These revenues are values from the Calculations section.
Total Cost of ManufactureThis is the sum of the costs for all vehicles. These costs of manufacture are values from the Calculations section.
Gross MarginThis is the difference between total revenue and total cost of manufacture.
Gross Margin PercentageThis is total revenue divided by total cost of manufacture. The company wants a gross margin of at least 30 percent.
Constraints and Running Solver
Next you must determine the constraints. You can assume that the marketing managers think at least 20,000 trucks, 20,000 SUVs, 20,000 sedans, 20,000 compacts, and 8,000 electric vehicles will be made and sold five years from now.
Use Solver to enter the base case constraints. You want to maximize total gross margin. Set Solver for GRG Nonlinear mode. Run Solver and ask for the Answer Report when Solver finds a solution that satisfies the constraints.
When you finish, print the entire spreadsheet and the Answer Report sheet. Save the file one more time using the Save command in the File tab, keeping the AutoMakerProductMix.xlsx filename. Then, to prepare for the extension case, use the Save As command in the File tab to create a new spreadsheet named AutoMakerProductMixExtension. xlsx.
\begin{tabular}{|l|l|} \hline 35 & \multicolumn{2}{|c|}{ C } \\ \hline 36 & Calculations \\ \hline 37 & Revenue: \\ \hline 38 & SUVs \\ \hline 39 & Sedans \\ \hline 40 & Compacts \\ \hline 41 & Electrics \\ 42 & Cost of Mamufacture: \\ \hline 43 & Trucks \\ \hline 44 & SUVs \\ 45 & Sedans \\ 46 & Compacts \\ 47 & Electrics \\ 48 & Total mumber of autos made \\ 49 & Fleet MPG \\ 50 & \\ \hline \end{tabular} \begin{tabular}{|l|l|l|l|} \hline & \multicolumn{1}{|c|}{ A } & B & C \\ \hline 51 & Income Statement & & \\ \hline 52 & Total Revenue & & \\ 53 & Total Cost of Manufacture & & \\ \hline 54 & Gross Margin & & \\ \hline 55 & & & \\ \hline 56 & Gross Margin Percentage & & \\ 57 & & \\ \hline \end{tabular} \begin{tabular}{|l|l|} \hline 35 & \multicolumn{2}{|c|}{ C } \\ \hline 36 & Calculations \\ \hline 37 & Revenue: \\ \hline 38 & SUVs \\ \hline 39 & Sedans \\ \hline 40 & Compacts \\ \hline 41 & Electrics \\ 42 & Cost of Mamufacture: \\ \hline 43 & Trucks \\ \hline 44 & SUVs \\ 45 & Sedans \\ 46 & Compacts \\ 47 & Electrics \\ 48 & Total mumber of autos made \\ 49 & Fleet MPG \\ 50 & \\ \hline \end{tabular} \begin{tabular}{|l|l|l|l|} \hline & \multicolumn{1}{|c|}{ A } & B & C \\ \hline 51 & Income Statement & & \\ \hline 52 & Total Revenue & & \\ 53 & Total Cost of Manufacture & & \\ \hline 54 & Gross Margin & & \\ \hline 55 & & & \\ \hline 56 & Gross Margin Percentage & & \\ 57 & & \\ \hline \end{tabular}Step by Step Solution
There are 3 Steps involved in it
Step: 1

Get Instant Access to Expert-Tailored Solutions
See step-by-step solutions with expert insights and AI powered tools for academic success
Step: 2

Step: 3

Ace Your Homework with AI
Get the answers you need in no time with our AI-driven, step-by-step assistance
Get Started


