Answered step by step
Verified Expert Solution
Question
1 Approved Answer
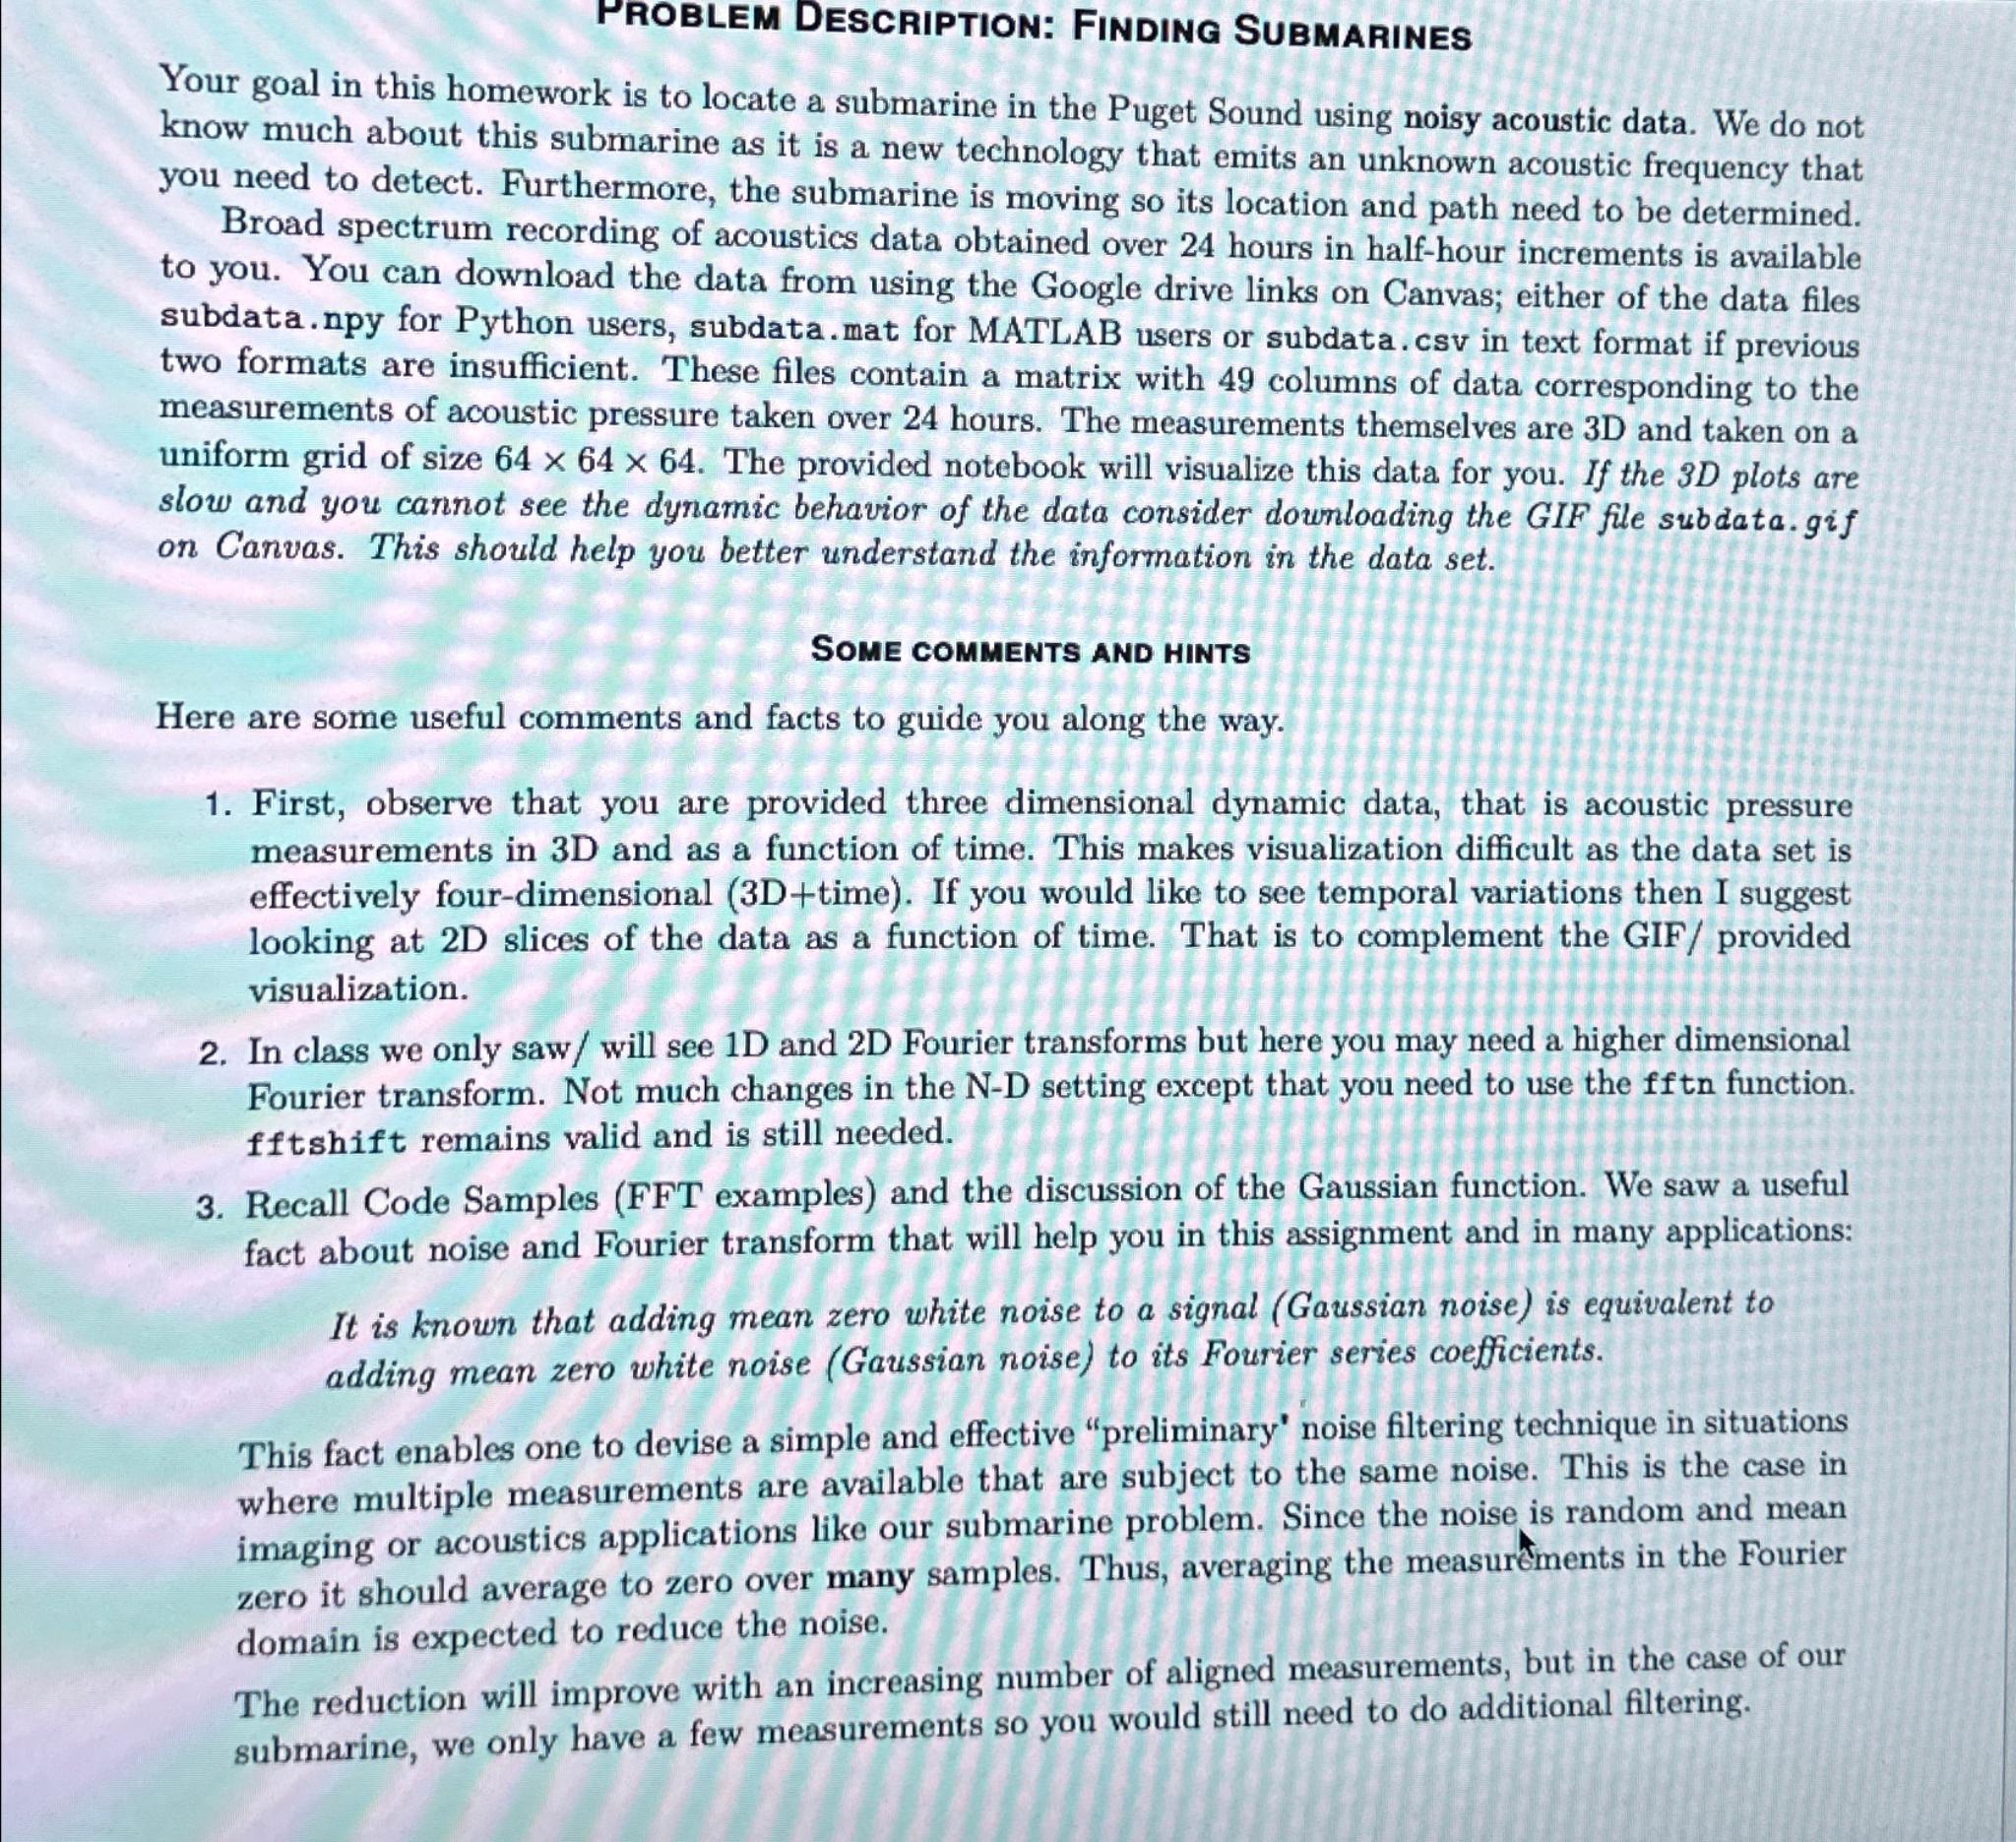
PROBLEM DESCRIPTION: FINDING SUBMARINES Your goal in this homework is to locate a submarine in the Puget Sound using noisy acoustic data. We do not
PROBLEM DESCRIPTION: FINDING SUBMARINES
Your goal in this homework is to locate a submarine in the Puget Sound using noisy acoustic data. We do not know much about this submarine as it is a new technology that emits an unknown acoustic frequency that you need to detect. Furthermore, the submarine is moving so its location and path need to be determined.
Broad spectrum recording of acoustics data obtained over hours in halfhour increments is available to you. You can download the data from using the Google drive links on Canvas; either of the data files subdata.npy for Python users, subdata.mat for MATLAB users or subdata.csv in text format if previous two formats are insufficient. These files contain a matrix with columns of data corresponding to the measurements of acoustic pressure taken over hours. The measurements themselves are and taken on a uniform grid of size The provided notebook will visualize this data for you. If the plots are slow and you cannot see the dynamic behavior of the data consider downloading the GIF file subdata.gif on Canvas. This should help you better understand the information in the data set.
SOME COMMENTS AND HINTS
Here are some useful comments and facts to guide you along the way.
First, observe that you are provided three dimensional dynamic data, that is acoustic pressure measurements in and as a function of time. This makes visualization difficult as the data set is effectively fourdimensional time If you would like to see temporal variations then I suggest looking at slices of the data as a function of time. That is to complement the GIF provided visualization.
In class we only saw will see and Fourier transforms but here you may need a higher dimensional Fourier transform. Not much changes in the ND setting except that you need to use the fftn function. fftshift remains valid and is still needed.
Recall Code Samples FFT examples and the discussion of the Gaussian function. We saw a useful fact about noise and Fourier transform that will help you in this assignment and in many applications:
It is known that adding mean zero white noise to a signal Gaussian noise is equivalent to adding mean zero white noise Gaussian noise to its Fourier series coefficients.
This fact enables one to devise a simple and effective "preliminary' noise filtering technique in situations where multiple measurements are available that are subject to the same noise. This is the case in imaging or acoustics applications like our submarine problem. Since the noise is random and mean zero it should average to zero over many samples. Thus, averaging the measurements in the Fourier domain is expected to reduce the noise.
The reduction will improve with an increasing number of aligned measurements, but in the case of our submarine, we only have a few measurements so you would still need to do additional filtering.

Step by Step Solution
There are 3 Steps involved in it
Step: 1

Get Instant Access to Expert-Tailored Solutions
See step-by-step solutions with expert insights and AI powered tools for academic success
Step: 2

Step: 3

Ace Your Homework with AI
Get the answers you need in no time with our AI-driven, step-by-step assistance
Get Started


