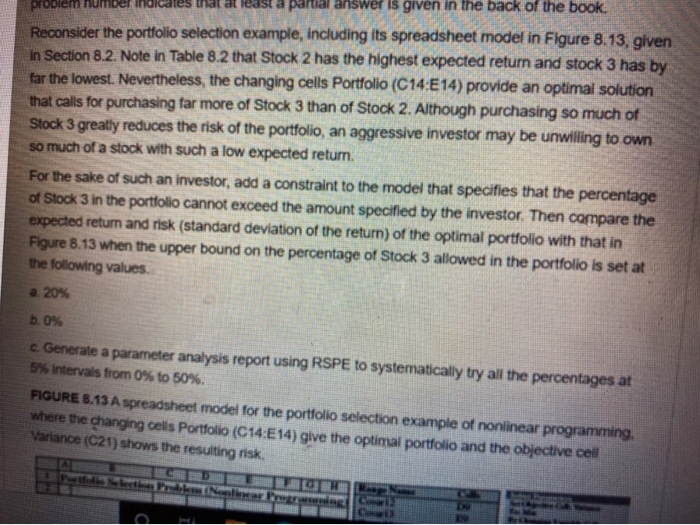
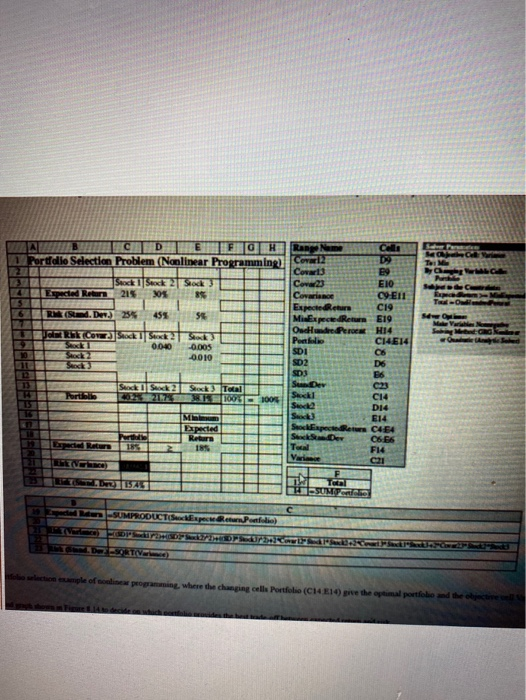
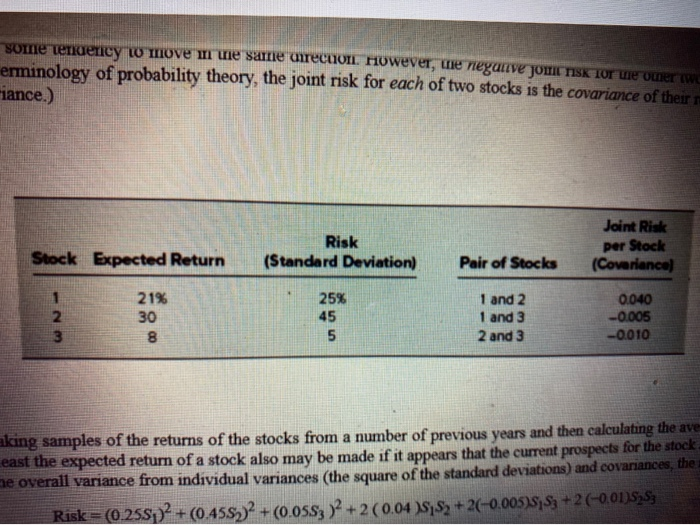
problem hun at least a partial answer is given in the back of the book. Reconsider the portfolio selection example, including its spreadsheet model in Figure 8.13, given in Section 8.2. Note in Table 8.2 that Stock 2 has the highest expected return and stock 3 has by far the lowest. Nevertheless, the changing cells Portfolio (C14:E14) provide an optimal solution that calls for purchasing far more of Stock 3 than of Stock 2. Although purchasing so much of Stock 3 greatly reduces the risk of the portfolio, an aggressive investor may be unwilling to own so much of a stock with such a low expected return. For the sake of such an investor, add a constraint to the model that specifies that the percentage of Stock 3 in the portfolio cannot exceed the amount specified by the investor. Then compare the expected return and risk (standard deviation of return) of the optimal portfolio with that in Figure 8.13 when the upper bound on the percentage of Stock 3 allowed in the portfolio is set at the following values a. 20% b. 0% c. Generate a parameter analysis report using RSPE to systematically try all the percentages at 5% Intervals from 0% to 50%. FIGURE 8.13 A spreadsheet model for the portfolio selection example of nonlinear programming, where the changing cells Portfolio (C14:E14) give the optimal portfolio and the objective cell Variance (C21) shows the resulting risk TEH 0.005 FTOH Ra No Call Mg Portfolio Selection Problem (Nonlinear Programming) Cola DO Covers E9 Stock 1 Sack Stock Cova23 EIO. 4 Espected Relen 215 205 89 Covariance CI-E11 ExpectedReturn C19 6 RN (Sted. Deva) 255 455 SE Mi ExpectedReun E19 MV OncedPerc H14 GRG FIRSTCONStock Seeck 2 Pelle C4E14 0.040 10 SDI C6 0010 Stock 3 SD2 D6 12 SD3 E6 Sey Stock Suck Stock Teal Poruba K1006 1005 Sal C14 Stock D14 MIN Stock E14 Expected Sopocie C454 th Return 06:56 Teral F14 Varie 1329 TO den SUMPRODUCTS De les emple of program where the change celle Portfolio (CH4 1 pre the portillo some tendency w move in te same urection. However, the negative JOWICTISK tor ne omer www erminology of probability theory, the joint risk for each of two stocks is the covariance of their Fiance.) Joint Risk Risk (Standard Deviation) per Stock Stock Expected Return Pair of Stocks (Covariance) 2. 3 21% 30 8 25% 45 5 1 and 2 1 and 3 2 and 3 0.040 -0.005 -0.010 aking samples of the returns of the stocks from a number of previous years and then calculating the ave east the expected return of a stock also may be made if it appears that the current prospects for the stock. ne overall variance from individual variances (the square of the standard deviations) and covariances, the Risk=(0.255p) + (0.455))2 + (0.05S; )2 + 2 (0.04 15:52 + 2(-0.005US S3 + 2 (-0.0115353


