

Question
Problem: Imagine that it is December 2017, and you have just accepted the chief financial officer (CFO) position at Hays County Integrated Delivery System (IDS),
Problem: Imagine that it is December 2017, and you have just accepted the chief financial officer (CFO) position at Hays County Integrated Delivery System (IDS), hereinafter referred to as County. You will be reporting to Mr. Salter, Countys chief executive officer, a retired schoolteacher who was hired last year. Also reporting to Mr. Salter are Dr. Spok, Countys medical director; Mr. Wannabe, Countys chief operating officer; Ms. Pincher, Countys controller; and Ms. Care, Countys director of nursing. When announcing your appointment, Mr. Salter stated that your primary objective in the coming year (2018) would be to reverse the ominous financial trend that began in 2016 with an operating loss and continued in 2017. Previous operating losses were funded with investment income (investment income was $200,000 in 2017); however, your board recently passed a resolution discontinuing that practice and restricting investment income to capital expenditures in 2017. County is a not-for-profit county-owned urban hospital and includes a 130-bed acute care hospital, a 35-bed skilled nursing facility (SNF), a 15-bed rehab facility, a home health care agency, and an outpatient clinic. It has a 40-member medical staff that bills independently. The hospital, Hays County Hospital (HCH), is one of two hospitals in the county (population is 175,000) and the only hospital in San Marcos, Texas, with a population of 50,000. St. Teresas, a not-for-profit Catholic-owned hospital, is the only other hospital in Hays County. St. Teresas is about 25 miles from Hays County IDS. To acquire background information, you decide to meet first with each member of the executive team and then with selected members of senior management.
Question: Analyze my capitated managed care agreement with the city and tell me the full cost profit / loss. Should we renew the contract for the next year at present rates, or should we ask for a rate increase and if so, how much rate increase do we need to cover our full cost.
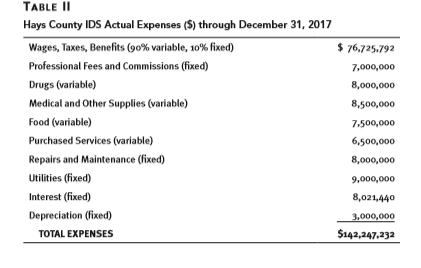
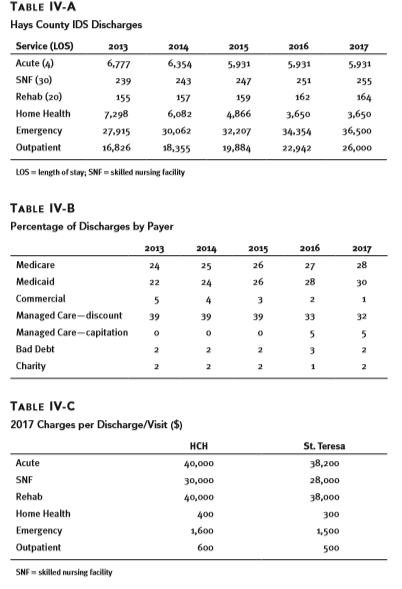
**You will need to use the data in the Tables given in the case. Particularly you will want to use Table II, Table IV-A, Table IV-B, and Table IV-C. You will also need to make some reasonable assumptions as you work through the problem. Your answer should consider financial analysis elements and strategy elements. For example, if you find the capitated contract with the city is losing money, don't jump to the conclusion to cancel the contract. Decide from a strategic perspective whether there is a way forward to renew the contract. There is no absolute right answer, but there are answers that meet the "test of reasonableness".**
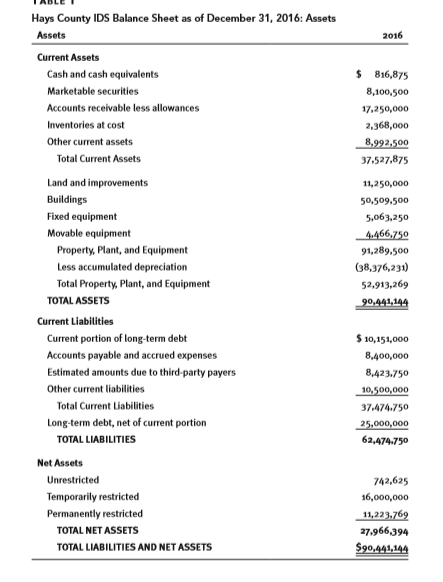
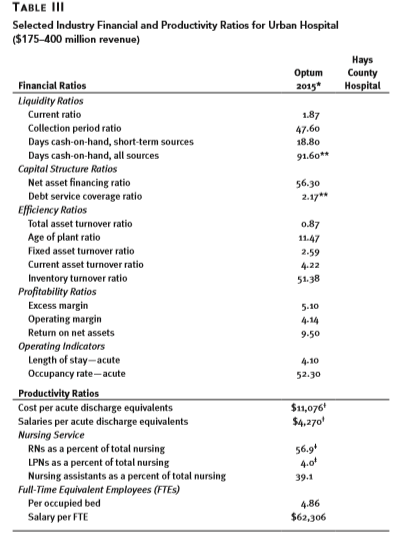
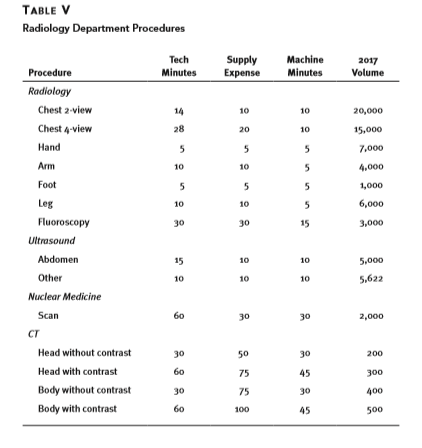
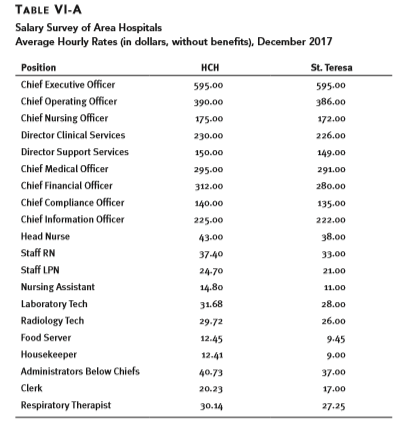
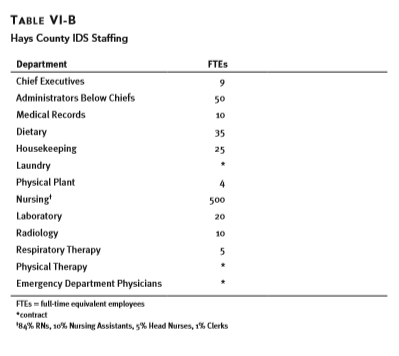
Hays County IDS Balance Sheet as of December 31, 2016: Assets Assets 2016 Current Assets Cash and cash equivalents Marketable securities Accounts receivable less allowances Inventories at cost Other current assets Total Current Assets $ 816,875 8,100,500 17.250,000 2,368,000 8,992,500 37.527.875 11,250,000 50,509.500 5,063,250 4,466,750 91,289.500 (38,376,231) 52,913,269 90,441,144 Land and improvements Buildings Fixed equipment Movable equipment Property, Plant, and Equipment Less accumulated depreciation Total Property, Plant, and Equipment TOTAL ASSETS Current Liabilities Current portion of long-term debt Accounts payable and accrued expenses Estimated amounts due to third-party payers Other current liabilities Total Current Liabilities Long-term debt, net of current portion TOTAL LIABILITIES $ 10,151,000 8,400,000 8,423.750 10,500,000 37.474.750 25,000,000 62,474.750 Net Assets Unrestricted Permanently restricted TOTAL NET ASSETS TOTAL LIABILITIES AND NET ASSETS 742,625 16,000,000 11,223,769 27.966394 $90,441,144 TABLE 11 Hays County IDS Actual Expenses (5) through December 31, 2017 Wages, Taxes, Benefits (90% variable, 10% fixed) Professional Fees and Commissions (fixed) Drugs (variable) Medical and Other Supplies (variable) Food (variable) Purchased Services (variable) Repairs and Maintenance (fixed) Utilities (fixed) Interest (fixed) Depreciation (fixed) TOTAL EXPENSES $76.725.792 7,000,000 8,000,000 8,500,000 7,500,000 6,500,000 8,000,000 9,000,000 8,021,440 3,000,000 $142,247,232 Selected Industry Financial and Productivity Ratios for Urban Hospital ($175-400 million revenue) Hays Optum County Financial Ratios 2015* Hospital Liquidity Ratios 1.87 Collection period ratio 47.60 Days cash-on-hand, short-term sources 18.80 Days cash-on-hand, all sources 91.60** Capital Structure Ratios Net asset financing ratio 56.30 Debt service coverage ratio 2.17 Efficiency Ratios Total asset turnover ratio 0.87 Age of plant ratio 11.47 Fixed asset turnover ratio 2.59 Current asset turnover ratio 4.22 Inventory turnover ratio 51.38 Profitability Ratios Excess margin 5.10 Operating margin 4.14 Return on net assets 9.50 Operating Indicators Length of stay-acute 4.10 Occupancy rate-acute 52.30 Productivity Ratios Cost per acute discharge equivalents $11,076 Salaries per acute discharge equivalents $4.270 Nursing Service RNs as a percent of total nursing 56.94 LPNs as a percent of total nursing Nursing assistants as a percent of total nursing 39.1 Full-Time Equivalent Employees (FTES) Per occupied bed 4.86 Salary per FTE $62,306 4.00 2016 2017 2015 5.931 TABLE IV-A Hays County IDS Discharges Service (LOS) 2013 Acute (A) 6.777 SNF (30) Rehab (20) 155 Home Health 7.298 Emergency 27.915 Outpatient 16,826 5.931 255 239 2014 6,354 243 157 6,082 30,062 18.355 159 164 5.931 251 162 3.650 34.354 22,942 4.866 32,207 19,884 3,650 36,500 26,000 LOS length of stay, SNF = skilled nursing facility 2014 2015 2016 2017 TABLE IV-B Percentage of Discharges by Payer 2013 Medicare Medicaid Commercial Managed Care-discount Managed Care-capitation Bad Debt Charity TABLE IV-C 2017 Charges per Discharge/Visit ($) HCH Acute 40,000 30,000 Rehab 40,000 Home Health 400 Emergency 1,600 Outpatient 600 SNE St. Teresa 38,200 28,000 38,000 300 1,500 500 SNF skilled nursing Facility TABLE V Radiology Department Procedures Tech Minutes Supply Expense Machine Minutes 2017 Volume Procedure 20,000 Radiology Chest 2-view Chest 4-view Hand 15,000 7.000 Arm 4.000 1,000 6,000 3,000 Leg Fluoroscopy Ultrasound Abdomen Other Nuclear Medicine 5,000 5,622 Scan 2,000 200 300 Head without contrast Head with contrast Body without contrast Body with contrast TABLE VI-A Salary Survey of Area Hospitals Average Hourly Rates (in dollars, without benefits), December 2017 HCH 595.00 390.00 175.00 230.00 150.00 Position Chief Executive Officer Chief Operating Officer Chief Nursing Officer Director Clinical Services Director Support Services Chief Medical Officer Chief Financial Officer Chief Compliance Officer Chief Information Officer Head Nurse Staff RN Staff LPN Nursing Assistant Laboratory Tech Radiology Tech Food Server Housekeeper Administrators Below Chiefs Clerk Respiratory Therapist St. Teresa 595.00 386.00 172.00 226.00 149.00 291.00 280.00 135.00 222.00 38.00 295.00 43.00 37-40 24.70 21.00 11.00 28.00 26.00 9.45 9.00 37.00 17.00 27.25 40.73 20.23 30.14 TABLE VI-B Hays County IDS Staffing Department Chief Executives Administrators Below Chiefs Medical Records Dietary Housekeeping Laundry Physical Plant Nursing! Laboratory Radiology Respiratory Therapy Physical Therapy Emergency Department Physicians FTES full-time equivalent employees contract 84% RNS, 10% Nursing Assistants, 5% Head Nurses, 1% Clerks Hays County IDS Balance Sheet as of December 31, 2016: Assets Assets 2016 Current Assets Cash and cash equivalents Marketable securities Accounts receivable less allowances Inventories at cost Other current assets Total Current Assets $ 816,875 8,100,500 17.250,000 2,368,000 8,992,500 37.527.875 11,250,000 50,509.500 5,063,250 4,466,750 91,289.500 (38,376,231) 52,913,269 90,441,144 Land and improvements Buildings Fixed equipment Movable equipment Property, Plant, and Equipment Less accumulated depreciation Total Property, Plant, and Equipment TOTAL ASSETS Current Liabilities Current portion of long-term debt Accounts payable and accrued expenses Estimated amounts due to third-party payers Other current liabilities Total Current Liabilities Long-term debt, net of current portion TOTAL LIABILITIES $ 10,151,000 8,400,000 8,423.750 10,500,000 37.474.750 25,000,000 62,474.750 Net Assets Unrestricted Permanently restricted TOTAL NET ASSETS TOTAL LIABILITIES AND NET ASSETS 742,625 16,000,000 11,223,769 27.966394 $90,441,144 TABLE 11 Hays County IDS Actual Expenses (5) through December 31, 2017 Wages, Taxes, Benefits (90% variable, 10% fixed) Professional Fees and Commissions (fixed) Drugs (variable) Medical and Other Supplies (variable) Food (variable) Purchased Services (variable) Repairs and Maintenance (fixed) Utilities (fixed) Interest (fixed) Depreciation (fixed) TOTAL EXPENSES $76.725.792 7,000,000 8,000,000 8,500,000 7,500,000 6,500,000 8,000,000 9,000,000 8,021,440 3,000,000 $142,247,232 Selected Industry Financial and Productivity Ratios for Urban Hospital ($175-400 million revenue) Hays Optum County Financial Ratios 2015* Hospital Liquidity Ratios 1.87 Collection period ratio 47.60 Days cash-on-hand, short-term sources 18.80 Days cash-on-hand, all sources 91.60** Capital Structure Ratios Net asset financing ratio 56.30 Debt service coverage ratio 2.17 Efficiency Ratios Total asset turnover ratio 0.87 Age of plant ratio 11.47 Fixed asset turnover ratio 2.59 Current asset turnover ratio 4.22 Inventory turnover ratio 51.38 Profitability Ratios Excess margin 5.10 Operating margin 4.14 Return on net assets 9.50 Operating Indicators Length of stay-acute 4.10 Occupancy rate-acute 52.30 Productivity Ratios Cost per acute discharge equivalents $11,076 Salaries per acute discharge equivalents $4.270 Nursing Service RNs as a percent of total nursing 56.94 LPNs as a percent of total nursing Nursing assistants as a percent of total nursing 39.1 Full-Time Equivalent Employees (FTES) Per occupied bed 4.86 Salary per FTE $62,306 4.00 2016 2017 2015 5.931 TABLE IV-A Hays County IDS Discharges Service (LOS) 2013 Acute (A) 6.777 SNF (30) Rehab (20) 155 Home Health 7.298 Emergency 27.915 Outpatient 16,826 5.931 255 239 2014 6,354 243 157 6,082 30,062 18.355 159 164 5.931 251 162 3.650 34.354 22,942 4.866 32,207 19,884 3,650 36,500 26,000 LOS length of stay, SNF = skilled nursing facility 2014 2015 2016 2017 TABLE IV-B Percentage of Discharges by Payer 2013 Medicare Medicaid Commercial Managed Care-discount Managed Care-capitation Bad Debt Charity TABLE IV-C 2017 Charges per Discharge/Visit ($) HCH Acute 40,000 30,000 Rehab 40,000 Home Health 400 Emergency 1,600 Outpatient 600 SNE St. Teresa 38,200 28,000 38,000 300 1,500 500 SNF skilled nursing Facility TABLE V Radiology Department Procedures Tech Minutes Supply Expense Machine Minutes 2017 Volume Procedure 20,000 Radiology Chest 2-view Chest 4-view Hand 15,000 7.000 Arm 4.000 1,000 6,000 3,000 Leg Fluoroscopy Ultrasound Abdomen Other Nuclear Medicine 5,000 5,622 Scan 2,000 200 300 Head without contrast Head with contrast Body without contrast Body with contrast TABLE VI-A Salary Survey of Area Hospitals Average Hourly Rates (in dollars, without benefits), December 2017 HCH 595.00 390.00 175.00 230.00 150.00 Position Chief Executive Officer Chief Operating Officer Chief Nursing Officer Director Clinical Services Director Support Services Chief Medical Officer Chief Financial Officer Chief Compliance Officer Chief Information Officer Head Nurse Staff RN Staff LPN Nursing Assistant Laboratory Tech Radiology Tech Food Server Housekeeper Administrators Below Chiefs Clerk Respiratory Therapist St. Teresa 595.00 386.00 172.00 226.00 149.00 291.00 280.00 135.00 222.00 38.00 295.00 43.00 37-40 24.70 21.00 11.00 28.00 26.00 9.45 9.00 37.00 17.00 27.25 40.73 20.23 30.14 TABLE VI-B Hays County IDS Staffing Department Chief Executives Administrators Below Chiefs Medical Records Dietary Housekeeping Laundry Physical Plant Nursing! Laboratory Radiology Respiratory Therapy Physical Therapy Emergency Department Physicians FTES full-time equivalent employees contract 84% RNS, 10% Nursing Assistants, 5% Head Nurses, 1% ClerksStep by Step Solution
There are 3 Steps involved in it
Step: 1

Get Instant Access to Expert-Tailored Solutions
See step-by-step solutions with expert insights and AI powered tools for academic success
Step: 2

Step: 3
Ace Your Homework with AI
Get the answers you need in no time with our AI-driven, step-by-step assistance
Get Started
The Complete Guide To Option Selling How Selling Options Can Lead To Stellar Returns In Bull And Bear Markets
Authors: James Cordier , Michael Gross
2nd Edition
0071733485