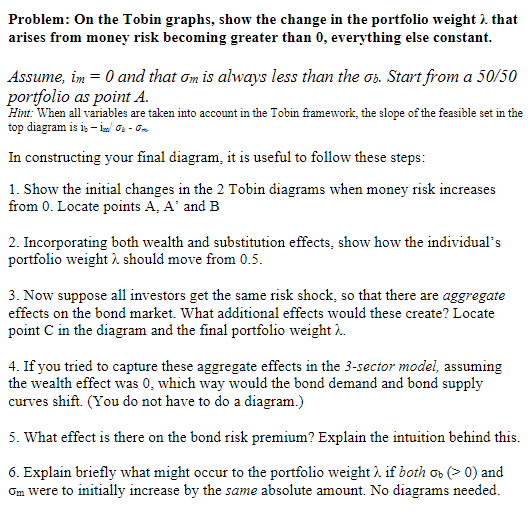
Problem: On the Tobin graphs, show the change in the portfolio weight 2. that arises from money risk becoming greater than 0, everything else constant. Assume, im = 0 and that Om is always less than the on. Start from a 50/50 portfolio as point A. Hint: When all variables are taken into account in the Tobin framework, the slope of the feasible set in the top diagram is is in Go-On In constructing your final diagram, it is useful to follow these steps: 1. Show the initial changes in the 2 Tobin diagrams when money risk increases from 0. Locate points A. A' and B 2. Incorporating both wealth and substitution effects, show how the individual's portfolio weight 2 should move from 0.5. 3. Now suppose all investors get the same risk shock, so that there are aggregate effects on the bond market. What additional effects would these create? Locate point C in the diagram and the final portfolio weight ... 4. If you tried to capture these aggregate effects in the 3-sector model, assuming the wealth effect was 0, which way would the bond demand and bond supply curves shift. (You do not have to do a diagram.) 5. What effect is there on the bond risk premium? Explain the intuition behind this. 6. Explain briefly what might occur to the portfolio weight 2 if both on (>0) and Om were to initially increase by the same absolute amount. No diagrams needed. Problem: On the Tobin graphs, show the change in the portfolio weight 2. that arises from money risk becoming greater than 0, everything else constant. Assume, im = 0 and that Om is always less than the on. Start from a 50/50 portfolio as point A. Hint: When all variables are taken into account in the Tobin framework, the slope of the feasible set in the top diagram is is in Go-On In constructing your final diagram, it is useful to follow these steps: 1. Show the initial changes in the 2 Tobin diagrams when money risk increases from 0. Locate points A. A' and B 2. Incorporating both wealth and substitution effects, show how the individual's portfolio weight 2 should move from 0.5. 3. Now suppose all investors get the same risk shock, so that there are aggregate effects on the bond market. What additional effects would these create? Locate point C in the diagram and the final portfolio weight ... 4. If you tried to capture these aggregate effects in the 3-sector model, assuming the wealth effect was 0, which way would the bond demand and bond supply curves shift. (You do not have to do a diagram.) 5. What effect is there on the bond risk premium? Explain the intuition behind this. 6. Explain briefly what might occur to the portfolio weight 2 if both on (>0) and Om were to initially increase by the same absolute amount. No diagrams needed


