Answered step by step
Verified Expert Solution
Question
1 Approved Answer
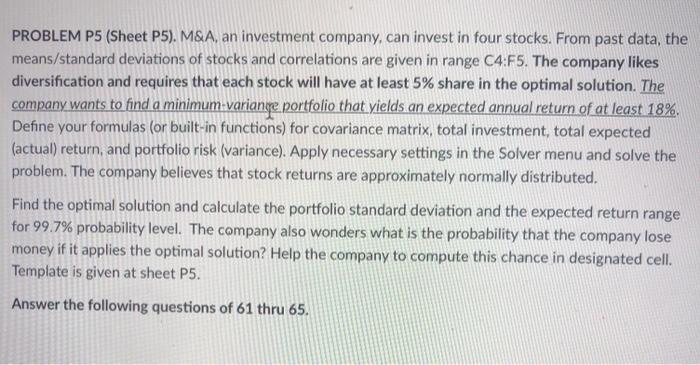
PROBLEM P5 (Sheet P5). M&A, an investment company, can invest in four stocks. From past data, the means/standard deviations of stocks and correlations are


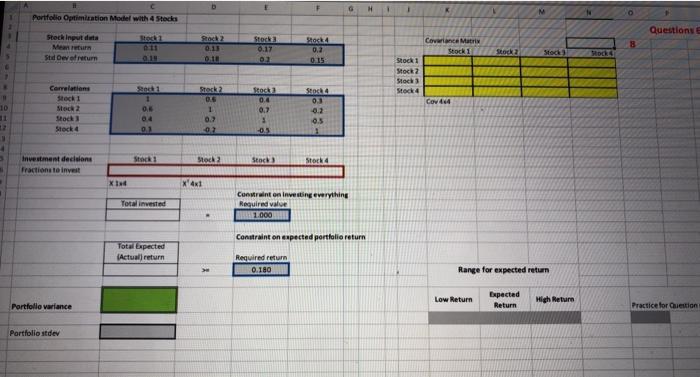
PROBLEM P5 (Sheet P5). M&A, an investment company, can invest in four stocks. From past data, the means/standard deviations of stocks and correlations are given in range C4:F5. The company likes diversification and requires that each stock will have at least 5% share in the optimal solution. The company wants to find a minimum-variange portfolio that yields an expected annual return of at least 18%. Define your formulas (or built-in functions) for covariance matrix, total investment, total expected (actual) return, and portfolio risk (variance). Apply necessary settings in the Solver menu and solve the problem. The company believes that stock returns are approximately normally distributed. Find the optimal solution and calculate the portfolio standard deviation and the expected return range for 99.7% probability level. The company also wonders what is the probability that the company lose money if it applies the optimal solution? Help the company to compute this chance in designated cell. Template is given at sheet P5. Answer the following questions of 61 thru 65. 1 10 Portfolio Optimization Model with 4 Stocks Stock input data Mean return Std Dev of return Correlations Stock 1 Stock 2 Stock 3 Stock 4 4 3 Investment decisions M Fractions to invest Portfolio variance Portfolio stdev XIM Stock 1 6:11 0.19 Stock 1 0.6 0.4 0.3 Stock 1 Total invested Total Expected (Actual) return Stock 2 0.13 0.18 Stock 2 0.5 1 0.7 07 Stock 2 x4x1 Stock 3 0.17 03 Stock 3 0.4 0.7 1 -0.5 Stock 3 F Stock 4 0.2 0.15 Stock 4 0.3 -0.2 0.5 1 Stock 4 G H Constraint on investing everything Required value 1.000 Constraint on expected portfolio return Required return 0.180 1 I Stock 1 Stock 2 Stock 3 Stock 4 Covariance Matrix Stock 1 Coved IN Low Return Stock 2 Range for expected return Stock Expected Return High Return Stock 4 Questions E Practice for Question s What is the highest return for the portfolio with 99.7% probability level? Please just enter a number with three decimal points. If the answer is 0.123456, just enter 0.123
Step by Step Solution
★★★★★
3.39 Rating (155 Votes )
There are 3 Steps involved in it
Step: 1
The empirical rule states that 997of data observed follo...
Get Instant Access to Expert-Tailored Solutions
See step-by-step solutions with expert insights and AI powered tools for academic success
Step: 2

Step: 3

Ace Your Homework with AI
Get the answers you need in no time with our AI-driven, step-by-step assistance
Get Started


