Answered step by step
Verified Expert Solution
Link Copied!

Question

1 Approved Answer

Problem sets Chap 9 Instructor: Bifgrson Juste Test statistics 1 Scores derived from a patient satisfaction survey are Normally distributed with p =50 and o
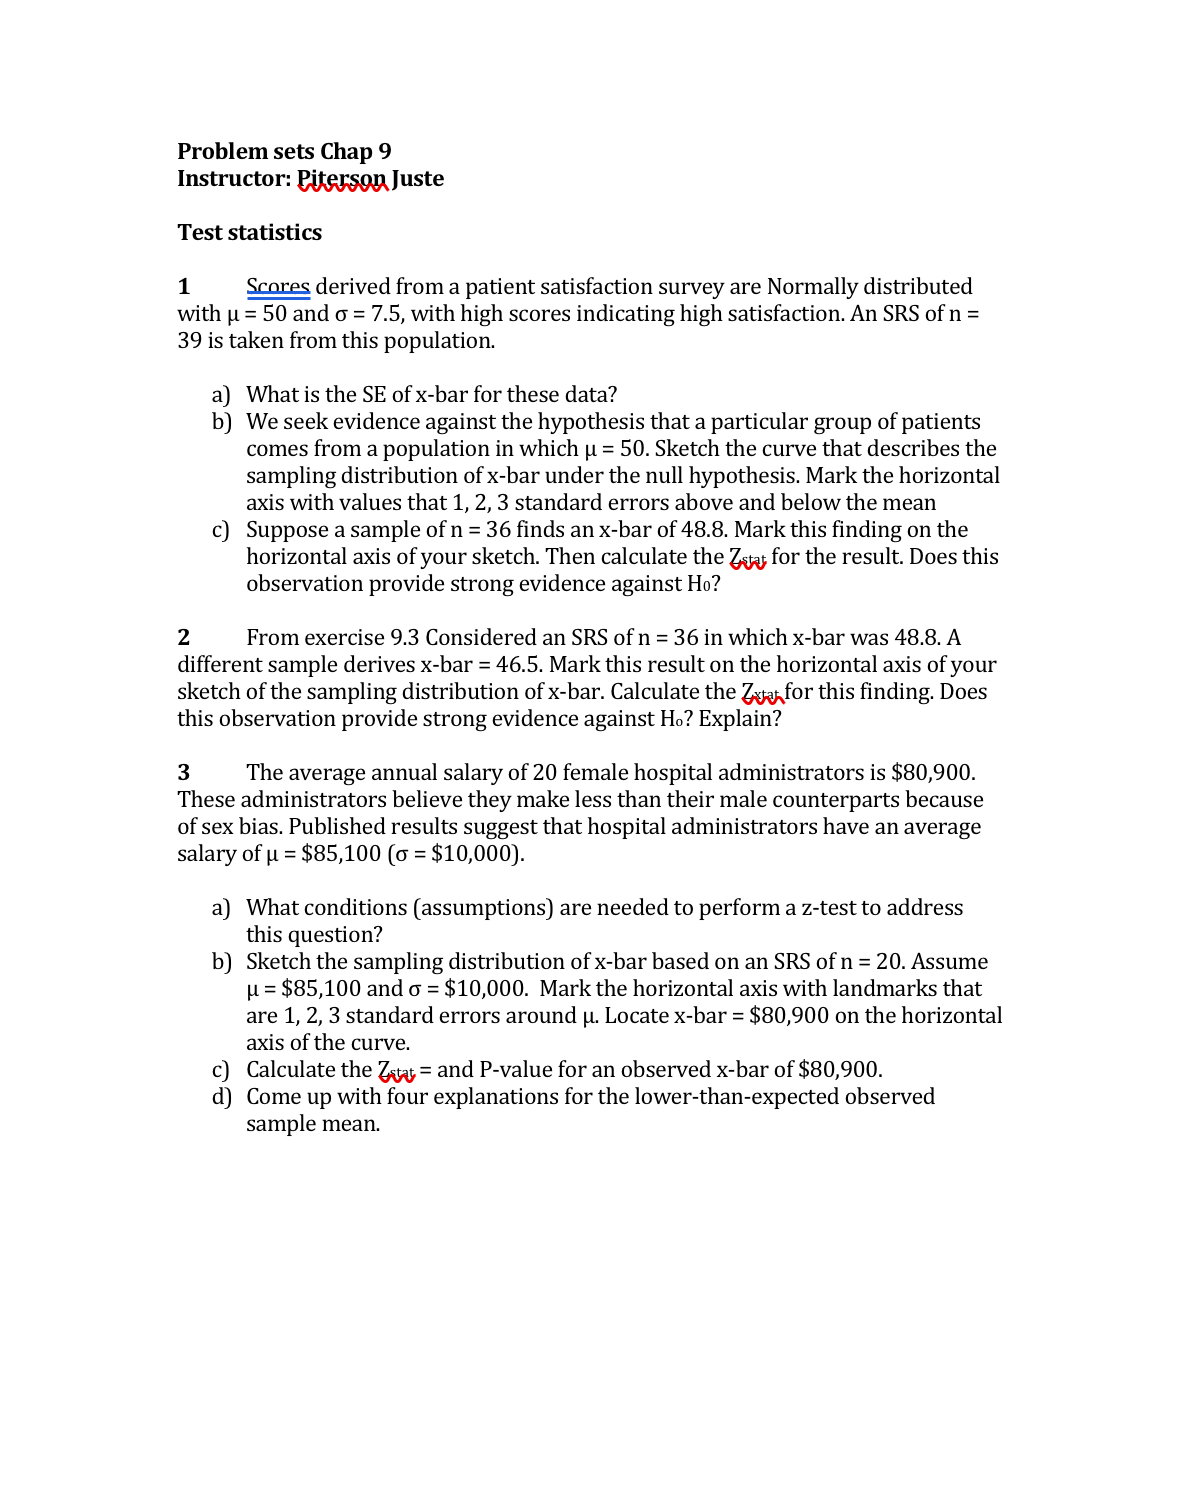
image text in transcribed
Problem sets Chap 9 Instructor: Bifgrson Juste Test statistics 1 Scores derived from a patient satisfaction survey are Normally distributed with p =50 and o = 7.5, with high scores indicating high satisfaction. An SRS of n = 39 is taken from this population. a) What is the SE of x-bar for these data? b) We seek evidence against the hypothesis that a particular group of patients comes from a population in which p = 50. Sketch the curve that describes the sampling distribution of x-bar under the null hypothesis. Mark the horizontal axis with values that 1, 2, 3 standard errors above and below the mean c) Suppose a sample of n = 36 finds an x-bar of 48.8. Mark this finding on the horizontal axis of your sketch. Then calculate the Zggz; for the result. Does this observation provide strong evidence against Ho? 2 From exercise 9.3 Considered an SRS of n = 36 in which x-bar was 48.8. A different sample derives x-bar = 46.5. Mark this result on the horizontal axis of your sketch of the sampling distribution of x-bar. Calculate the Zyqxfor this finding. Does this observation provide strong evidence against Ho? Explain? 3 The average annual salary of 20 female hospital administrators is $80,900. These administrators believe they make less than their male counterparts because of sex bias. Published results suggest that hospital administrators have an average salary of u = $85,100 (o = $10,000). a) What conditions (assumptions) are needed to perform a z-test to address this question? b) Sketch the sampling distribution of x-bar based on an SRS of n = 20. Assume 1 =$85,100 and = $10,000. Mark the horizontal axis with landmarks that are 1, 2, 3 standard errors around . Locate x-bar = $80,900 on the horizontal axis of the curve. c) Calculate the Zyz; = and P-value for an observed x-bar of $80,900. d) Come up with four explanations for the lower-than-expected observed sample mean

Step by Step Solution

There are 3 Steps involved in it

Step: 1

blur-text-image

Get Instant Access to Expert-Tailored Solutions

See step-by-step solutions with expert insights and AI powered tools for academic success

Step: 2

blur-text-image

Step: 3

blur-text-image

Ace Your Homework with AI

Get the answers you need in no time with our AI-driven, step-by-step assistance

Get Started

Recommended Textbook for

Probability and Random Processes With Applications to Signal Processing and Communications

Authors: Scott Miller, Donald Childers

2nd edition

123869811, 978-0121726515, 121726517, 978-0130200716, 978-0123869814

More Books

Students also viewed these Mathematics questions