Question
Problem Statement For each of the following problems, write two solutions, where each solution solves the problem using a different approach. Approaches count as different
Problem Statement
For each of the following problems, write two solutions, where each solution solves the problem using a different approach. Approaches count as different if they cluster at least some subtasks of the problems differently (like we saw for the Rainfall solutions in lecture); mere syntactic differences, such as replacing an element-based for-loop with an index-based one, or moving code into a helper without changing the order of the underlying computation, don't count as different.
For each problem, you will be asked to identify (in a comment) the (sub)tasks that make up that problem. For Rainfall, we'd be looking for a sequence of phrases such as "summing elements, counting elements, ignoring negative elements, stopping at the -999". This wording doesn't need to be exact (it'll be graded by humans) - they just need to convey the core computational tasks within the problem.
Please download and use this set of starter classes(https://web.cs.wpi.edu/~cs2102/b18/hw/hw3/StarterCode.zip). The starter files contain all the classes needed for this assignment, as well as the classes in which to put your answers (to aid us in grading). You may add whatever methods you wish to these classes, but please don't rename any classes, fields, or methods. The section below on "Using the Starter Files" explains the starter files and where you should edit them with your solutions.
Programming Problems
Cable providers maintain lists of TV shows, their episodes, and their airdates. The starter files include a Show class and an Episode class. A Show contains a list of Episodes. The first two programming problems will refer to these classes.
Problem 1: The Show Sorter
A cable provider wants to organize its schedule into lists of daytime, primetime, late night, overnight, and special shows. Daytime shows have a start time at or after 6:00 am and before 5:00 pm. Primetime shows have a start time at or after 5:00 pm and before 10:00 pm. Late night shows have a start time at or after 10:00 pm and before 1:00 am. All other non-special shows are overnight. Specials are one-time shows that can be on any time of day. At the moment, the cable provider is interested in non-special daytime, primetime, and late night shows but none of the others.
Design a program called organizeShows that consumes a list of Shows and produces a report containing all of the daytime, primetime, and late night shows in the list that are not specials. The shows within each list in the report should be in the same order as in the original list. You may assume that no two shows have the same name. Use the ShowSummary class in the starter files for the report.
A show's broadcast time is expressed in military (24-hour) time. For instance, if a show starts at 7:00 pm, then the value of broadcastTime will be 1900.
The starter files provide a concrete test case for this method.
In a comment at the bottom of the ShowExamples.java file, identify the subtasks for Problem 1. Your comment will be graded.
NOTE: Please do not modify the Show, Episode, or ShowSummary files. All of your functionality should be in ShowManager1 and ShowManager2, and all of your examples should be in ShowExamples.
Problem 2: Data Smoothing
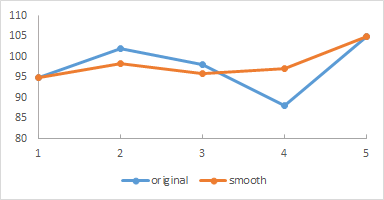
In data analysis, smoothing a data set means approximating it to capture important patterns in the data while eliding noise or other fine-scale structures and phenomena. One simple smoothing technique is to replace each (internal) element of a sequence of values with the average of that element and its predecessor and successor. Assuming that extreme outlier values are an abberation caused, perhaps, through poor measurement, this averaging process replaces them with a more plausible value in the context of that sequence.
For example, consider this sequence of values:
95 102 98 88 105
The resulting smoothed sequence should be
95.0 98.33333 96.0 97.0 105.0
where:
102 was substituted by 98.33333: (95 + 102 + 98) / 3
98 was substituted by 96: (102 + 98 + 88) / 3
88 was substituted by 97: (98 + 88 + 105) / 3
(numbers such as 98.3333 do NOT need to be rounded or truncated).
This information can be plotted in a graph such as below, with the smoothed graph superimposed over the original values.

Design a program dataSmooth that consumes a list of Shows, calculates the average runtime for each show, and produces a list of the smoothed runTime values (not the entire records). The average runtime is the sum of the runtimes of all episodes in the show divided by the number of episodes.
In a comment at the bottom of the DataSmoothExamples.java file, identify the subtasks for Problem 2. Your comment will be graded.
Problem 3: Earthquake Monitoring
Geologists want to monitor a local mountain for potential earthquake activity. They have installed a sensor to track seismic (vibration of the earth) activity. The sensor sends measurements one at a time over the network to a computer at a research lab. The sensor inserts markers among the measurements to indicate the date of the measurement. The sequence of values coming from the sensor looks as follows:
20151004 200 150 175 20151005 0.002 0.03 20151007 130 0.54 20151101 78 ...
The 8-digit numbers are dates (in year-month-day format). Numbers between 0 and 500 are vibration frequencies (in Hz). Frequencies below 0 sometimes occur, but they are physically impossible and thus ignored as erroneous data (usually due to equipment fault). This example shows readings of 200, 150, and 175 on October 4th, 2015 and readings of 0.002 and 0.03 on October 5th, 2015. There are no data for October 6th (sometimes there are problems with the network, so data go missing). Assume that the data are in order by dates (so a later date never appears before an earlier one in the sequence) and that all data are from the same year. The dates will always be 8-digit numbers in the format show above (and starting with a non-0 digit).
You may also assume that every date is followed by at least one frequency (in other words, every date has at least one measurement). Furthermore, you may assume that no date will be followed by only negative data.
Design a program dailyMaxForMonth that consumes a list of sensor data (doubles) and a month (represented by a number between 1 and 12) and produces a list of reports (MaxHzReport) indicating the highest frequency reading for each day in that month. Only include entries for dates that are part of the data provided (so don't report anything for October 6th in the example shown). Ignore data for months other than the given one, and ignore negative frequency values. Each entry in your report should be an instance of the MaxHzReportclass in the starter files.
For example, given the sequence of values above and the month 10 (for October), the resulting list should be:
[MaxHzReport(20151004, 200), MaxHzReport(20151005, 0.03), MaxHzReport(20151007, 130)]
In a comment at the bottom of the EarthquakeExamples.java file, identify the subtasks for Problem 3. Your comment will be graded.
NOTE: Please do not modify the MazHzReport class.
Using the Starter Files
The starter files zip has a lot of files. Here's a guide to what you will find in there.
For each problem, there are at least three files:
Files named
A file named
Auxiliary files with the classes for reports, Shows, Episodes, etc. The ones that are used in the output of methods have equals and toString methods, to aid checking your work.
Please post to the forum if you need help understanding the files. We set these up in advance to (a) help autograding, and (b) save you from having to do this setup yourselves.
110 105 100 95 90 85 80 110 105 100 95 90 85 80Step by Step Solution
There are 3 Steps involved in it
Step: 1

Get Instant Access to Expert-Tailored Solutions
See step-by-step solutions with expert insights and AI powered tools for academic success
Step: 2

Step: 3

Ace Your Homework with AI
Get the answers you need in no time with our AI-driven, step-by-step assistance
Get Started


