Answered step by step
Verified Expert Solution
Question
1 Approved Answer
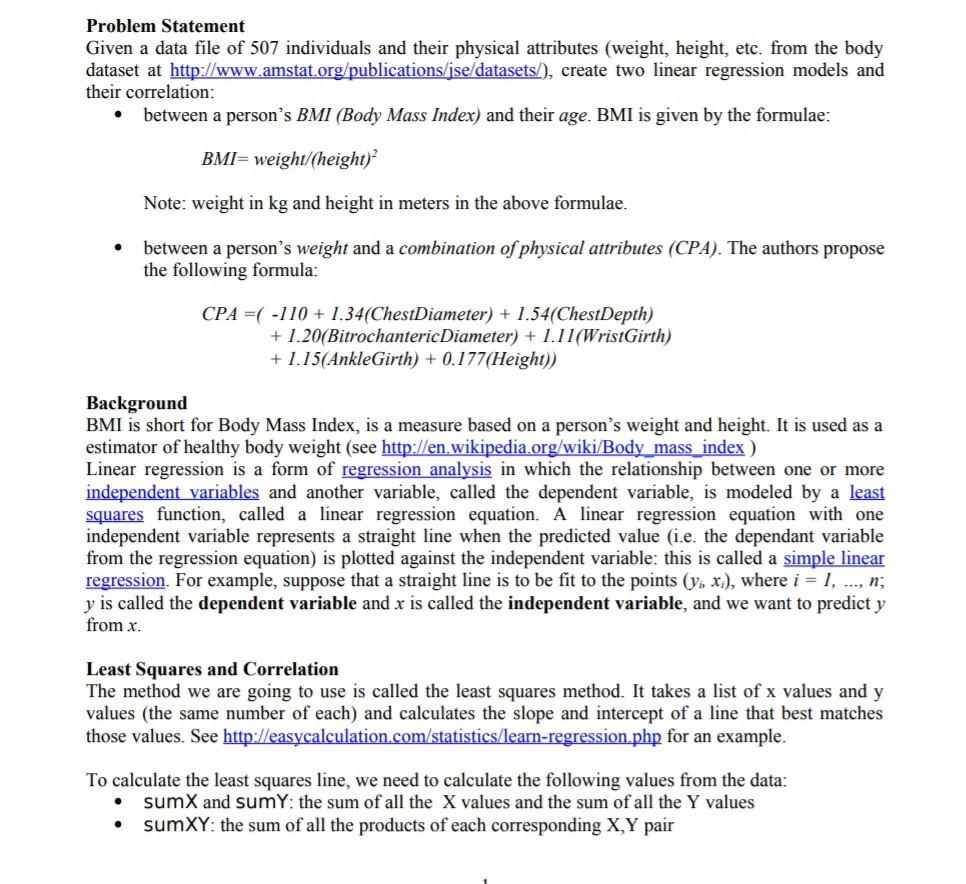
Problem Statement Given a data file of 507 individuals and their physical attributes (weight, height, etc. from the body dataset at http://www.amstat.org/publications/jse/datasets/), create two linear


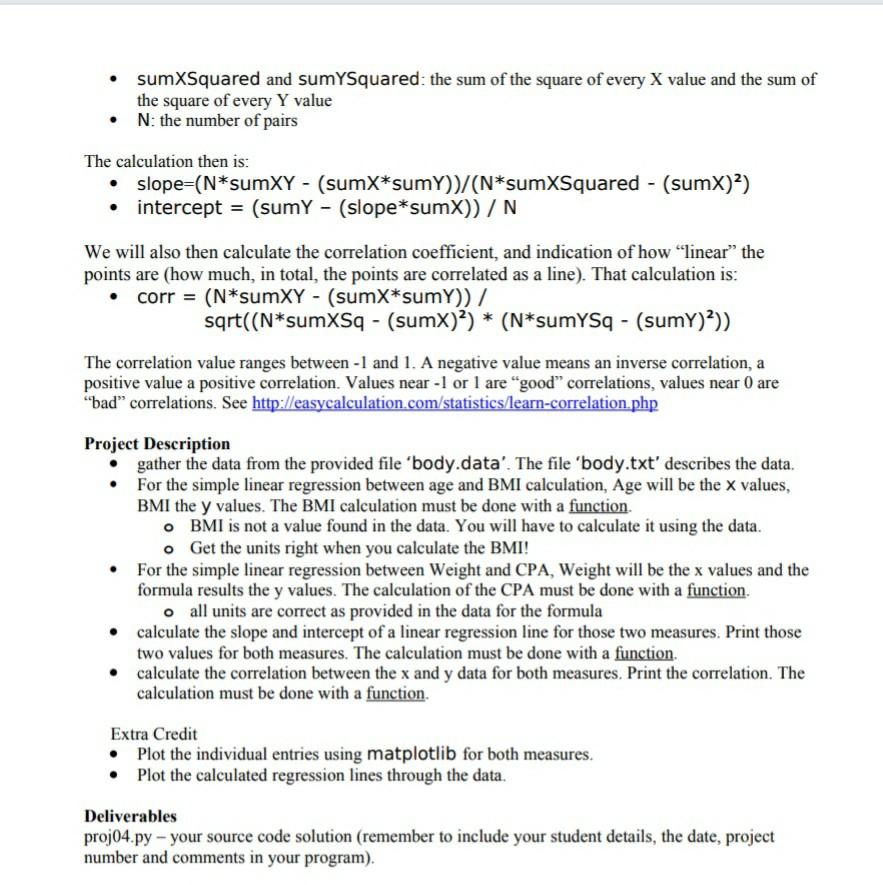
Problem Statement Given a data file of 507 individuals and their physical attributes (weight, height, etc. from the body dataset at http://www.amstat.org/publications/jse/datasets/), create two linear regression models and their correlation: between a person's BMI (Body Mass Index) and their age. BMI is given by the formulae: BMI= weight/(height) Note: weight in kg and height in meters the above formulae. between a person's weight and a combination of physical attributes (CPA). The authors propose the following formula: CPA =( -110 + 1.34(ChestDiameter) + 1.54(ChestDepth) + 1.20(Bitrochanteric Diameter) + 1.11(WristGirth) + 1.15(AnkleGirth) + 0.177(Height)) Background BMI is short for Body Mass Index, is a measure based on a person's weight and height. It is used as a estimator of healthy body weight (see http://en.wikipedia.org/wiki/Body_mass_index ) Linear regression is a form of regression analysis in which the relationship between one or more independent variables and another variable, called the dependent variable, is modeled by a least squares function, called a linear regression equation. A linear regression equation with one independent variable represents a straight line when the predicted value (i.e. the dependant variable from the regression equation) is plotted against the independent variable: this is called a simple linear regression. For example, suppose that a straight line is to be fit to the points (y; x;), where i = 1, ..., n; y is called the dependent variable and x is called the independent variable, and we want to predict y from x. Least Squares and Correlation The method we are going to use is called the least squares method. It takes a list of x values and y values (the same number of each) and calculates the slope and intercept of a line that best matches those values. See http://easycalculation.com/statistics/learn-regression.php for an example. To calculate the least squares line, we need to calculate the following values from the data: sumX and sumy: the sum of all the X values and the sum of all the Y values sumXY: the sum of all the products of each corresponding X,Y pair . . sumXSquared and sumySquared: the sum of the square of every X value and the sum of the square of every Y value N: the number of pairs The calculation then is: slope=(N*sumXY - (sumX*sumy))/(N*sumXSquared - (sumx)3) intercept = (sumy - (slope*sumx))/N We will also then calculate the correlation coefficient, and indication of how linear the points are (how much, in total, the points are correlated as a line). That calculation is: corr = (N*sumXY - (sumX*sumy)) / sqrt((N*sumXSq - (sumx)?) * (N*sumySq - (sumy)2)) The correlation value ranges between-1 and 1. A negative value means an inverse correlation, a positive value a positive correlation. Values near - 1 or 1 are good correlations, values near 0 are "bad" correlations. See http://easycalculation.com/statistics/learn-correlation.php Project Description gather the data from the provided file 'body.data'. The file 'body.txt' describes the data. For the simple linear regression between age and BMI calculation, Age will be the x values, BMI the y values. The BMI calculation must be done with a function. BMI is not a value found in the data. You will have to calculate it using the data. o Get the units right when you calculate the BMI! For the simple linear regression between Weight and CPA, Weight will be the x values and the formula results the y values. The calculation of the CPA must be done with a function. o all units are correct as provided in the data for the formula calculate the slope and intercept of a linear regression line for those two measures. Print those two values for both measures. The calculation must be done with a function. calculate the correlation between the x and y data for both measures. Print the correlation. The calculation must be done with a function. Extra Credit Plot the individual entries using matplotlib for both measures. Plot the calculated regression lines through the data. Deliverables proj04.py - your source code solution (remember to include your student details, the date, project number and comments in your program)
Step by Step Solution
There are 3 Steps involved in it
Step: 1

Get Instant Access to Expert-Tailored Solutions
See step-by-step solutions with expert insights and AI powered tools for academic success
Step: 2

Step: 3

Ace Your Homework with AI
Get the answers you need in no time with our AI-driven, step-by-step assistance
Get Started


