

Question
Problem Statement Suppose that you begin planning your investments on your 40 th birthday (the sooner you start, the better!), retire at the age of
Problem Statement
Suppose that you begin planning your investments on your 40th birthday (the sooner you start, the better!), retire at the age of 65, and expect some amount of growth in your salary year to year. Further suppose that you intend to invest some consistent proportion of your income each year and wish to understand the final value of your retirement account based on what proportion of your income you invest each year. Finally, to make the math easier, lets assume that you deposit each years investment all at once at the beginning of the year. NOTE: Like the demonstration video from this Module, you can tweak and reuse this template for your own personal planning :)
Part 1
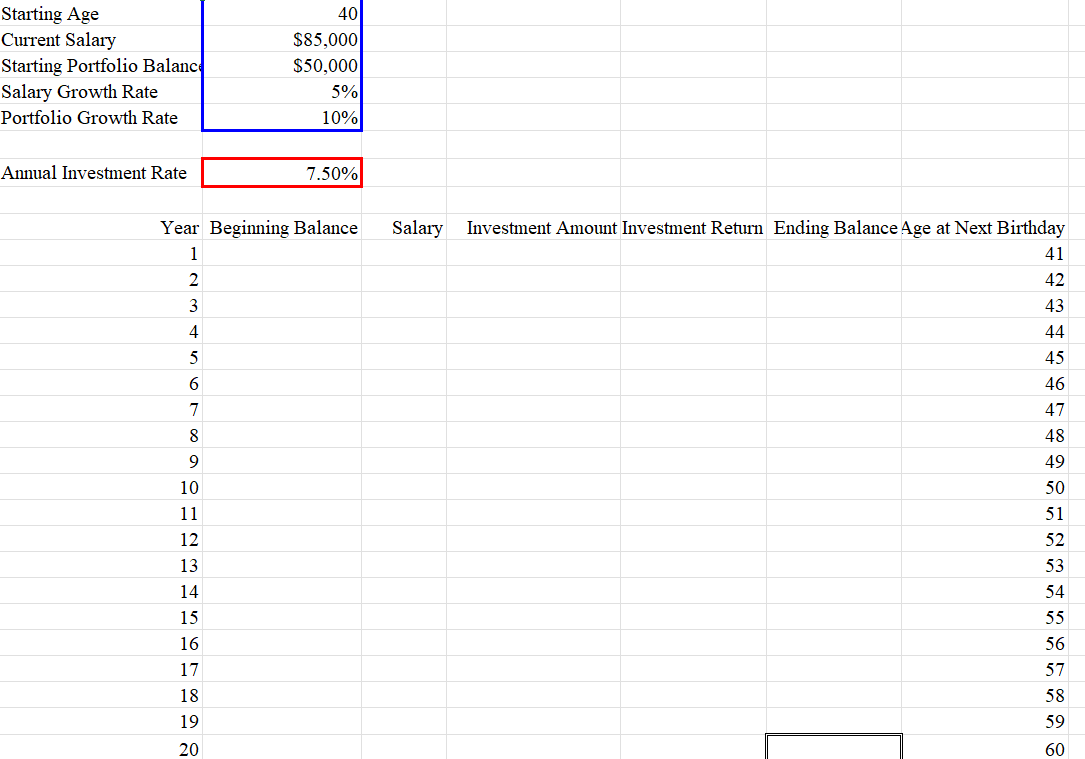
Suppose youve set a goal of having a million dollars in your retirement portfolio by the age of 60; begin by developing a what-if model using the template provided to represent the problem above i.e. to assess what balance you can expect at the age of 60. To make the math easy, assume for the moment that both your salary growth and your portfolios return on investment will be consistent each year. To validate your model, enter an Annual Investment Rate of 7.5%; if you have built the model correctly, you should find a Total Profit of $907,782. Once youve confirmed that your what-if model is correct, use Goal Seek to determine the minimum Annual Investment Rate necessary to have a balance of at least $1,000,000 when you turn 60.
Part 2
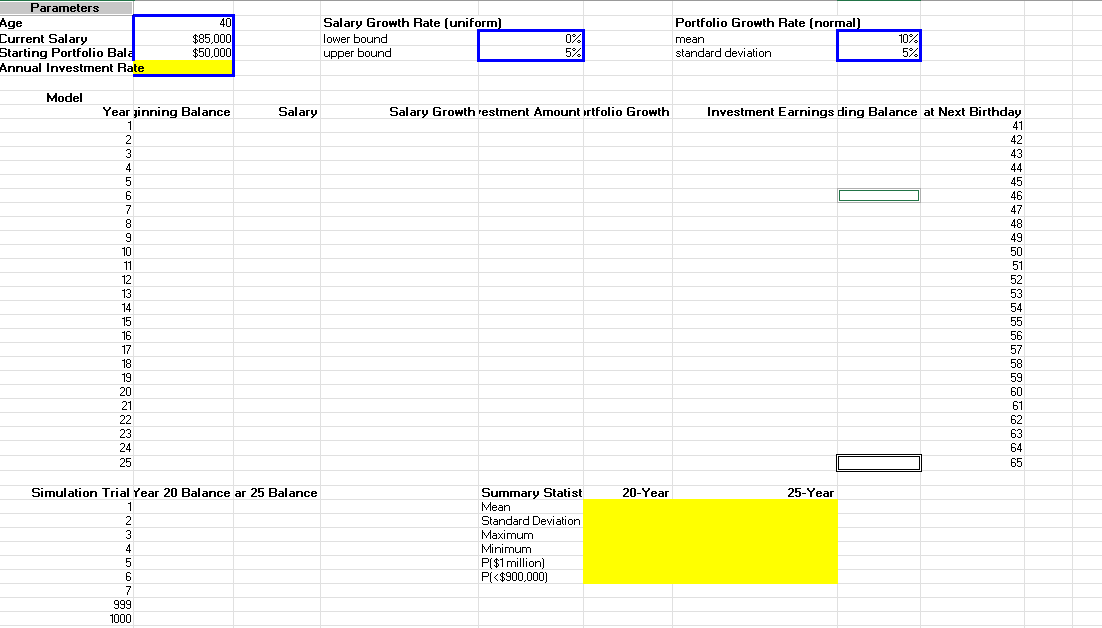
Now turn to the Part 2 worksheet where we will expand on the ideas of Part 1. First, copy the investment return rate you found through Goal Seek in Part 1, then paste-values-only (found in the right-click menu) into the according Annual Investment Rate (cell B5) on the Part 2 worksheet. Next, use the techniques of Monte Carlo simulation to simulate your Salary Growth and Investment Earnings for each year in columns D and G. Then, adapt the formulas you developed in Part 1 to this version of the problem. If done correctly, you should be able to copy-and-paste or Fill the formulas from the second row of the table (row 10) all the way down through year 25. Be careful when you fill the formulas though, and either paste-formulas-only in the right-click menu or Fill Without Formatting so that you do not overwrite the double border and bold in cell H33.
Given that this problem is highly uncertain, I cannot give you a reliable number for validation, but the 25-year balance should likely be somewhere around 1.5 million. To see if your spreadsheet is producing this result, repeatedly click  under the Formulas tab and see if the values seem to center around a million and a half.
Obviously, a more scientific approach than the eyeballing it would be preferable, which we can achieve through a Data Table, as we did in the Simulation Replications lecture video. The table has been mostly prepared for you, and just needs relative references (dont hard code!) in cells B36 and B37 to bring in the predicted balance in Year 20 and 25 respectively. After those formulas are referenced, create the Data Table to include all 1000 Simulation Trials. To facilitate this, Trials 8 through 998 are hidden.
After completing the Data Table, complete the yellow-highlighted cells to provide summary statistics for all 1000 replications of both key years in the Data Table. For validation, your 20-Year Mean should be around $860k-$875k, and again the 25-Year Mean should be around $1.47 million to $1.50 million.
please fill in both Excel sheets and show formulas!
\begin{tabular}{|c|c|c|c|c|c|} \hline Starting Age & 40 & & & & \\ \hline Current Salary & $85,000 & & & & \\ \hline Starting Portfolio Balanc & $50,000 & & & & \\ \hline Salary Growth Rate & 5% & & & & \\ \hline Portfolio Growth Rate & 10% & & & & \\ \hline Annual Investment Rate & 7.50% & & & & \\ \hline Year & Beginning Balance & Salary & Investment Amount Investment Return & Ending Balance & Age at Next Birthday \\ \hline 1 & & & & & 41 \\ \hline 2 & & & & & 42 \\ \hline 3 & & & & & 43 \\ \hline 4 & & & & & 44 \\ \hline 5 & & & & & 45 \\ \hline 6 & & & & & 46 \\ \hline 7 & & & & & 47 \\ \hline 8 & & & & & 48 \\ \hline 9 & & & & & 49 \\ \hline 10 & & & & & 50 \\ \hline 11 & & & & & 51 \\ \hline 12 & & & & & 52 \\ \hline 13 & & & & & 53 \\ \hline 14 & & & & & 54 \\ \hline 15 & & & & & 55 \\ \hline 16 & & & & & 56 \\ \hline 17 & & & & & 57 \\ \hline 18 & & & & & 58 \\ \hline 19 & & & & & 59 \\ \hline 20 & & & & & 60 \\ \hline \end{tabular} Calculate Now \begin{tabular}{|c|c|c|c|c|c|c|c|c|} \hline \multicolumn{9}{|l|}{ Parameters } \\ \hline Age & 40 & & \multicolumn{2}{|c|}{ Salary Growth Rate [uniform] } & & \multicolumn{2}{|c|}{ Portfolio Growth Rate [normal] } & \\ \hline Eurrent Salary & $85,000 & & lower bound & 0% & & mean & 10% & \\ \hline Starting Portfolio Bala & $50,000 & & upper bound & 5% & & standard deviation & 5% & \\ \hline \multicolumn{9}{|l|}{ Annual Investment Rate } \\ \hline \multirow{2}{*}{\multicolumn{9}{|c|}{ Model }} \\ \hline \multirow{2}{*}{\multicolumn{2}{|c|}{\begin{tabular}{c} Year jinning Balance \\ 1 \end{tabular}}} & Salary & & & & & & \\ \hline & & Jaialy & & Salary Growth restment Amount irtfolio Growth & 1100 Growtn & Investment Earnings & ding Balance & at Next Birthday \\ \hline 2 & & & & & & & & 42 \\ \hline 3 & & & & & & & & 43 \\ \hline 4 & & & & & & & & 44 \\ \hline 5 & & & & & & & & 45 \\ \hline 6 & & & & & & & & 46 \\ \hline 7 & & & & & & & & 47 \\ \hline 8 & & & & & & & & 48 \\ \hline 9 & & & & & & & & 49 \\ \hline 10 & & & & & & & & 50 \\ \hline 11 & & & & & & & & 51 \\ \hline 12 & & & & & & & & 52 \\ \hline 13 & & & & & & & & 53 \\ \hline 14 & & & & & & & & 54 \\ \hline 15 & & & & & & & & 55 \\ \hline 16 & & & & & & & & 56 \\ \hline 17 & & & & & & & & 57 \\ \hline 18 & & & & & & & & 58 \\ \hline 19 & & & & & & & & 59 \\ \hline 20 & & & & & & & & 60 \\ \hline 21 & & & & & & & & 61 \\ \hline 22 & & & & & & & & 62 \\ \hline 23 & & & & & & & & 63 \\ \hline 24 & & & & & & & & 64 \\ \hline 25 & & & & & & & & 65 \\ \hline Girulio & & & & & & & & \\ \hline Simulation Trial & Year 20 Balance & ar 25 Balance & & Summary Statist & 20-Year & 25-Year & & \\ \hline & & & & Mean & & & & \\ \hline 2 & & & & Standard Deviation & & & & \\ \hline 3 & & & & Maximum & & & & \\ \hline 4 & & & & Minimum & & & & \\ \hline 5 & & & & P($1 million ) & & & & \\ \hline 6 & & & & P(Step by Step Solution
There are 3 Steps involved in it
Step: 1

Get Instant Access to Expert-Tailored Solutions
See step-by-step solutions with expert insights and AI powered tools for academic success
Step: 2

Step: 3
Ace Your Homework with AI
Get the answers you need in no time with our AI-driven, step-by-step assistance
Get Started
Fundamentals Of Investments
Authors: Bradford Jordan, Thomas Miller
4th Edition
0073314978, 9780073314976