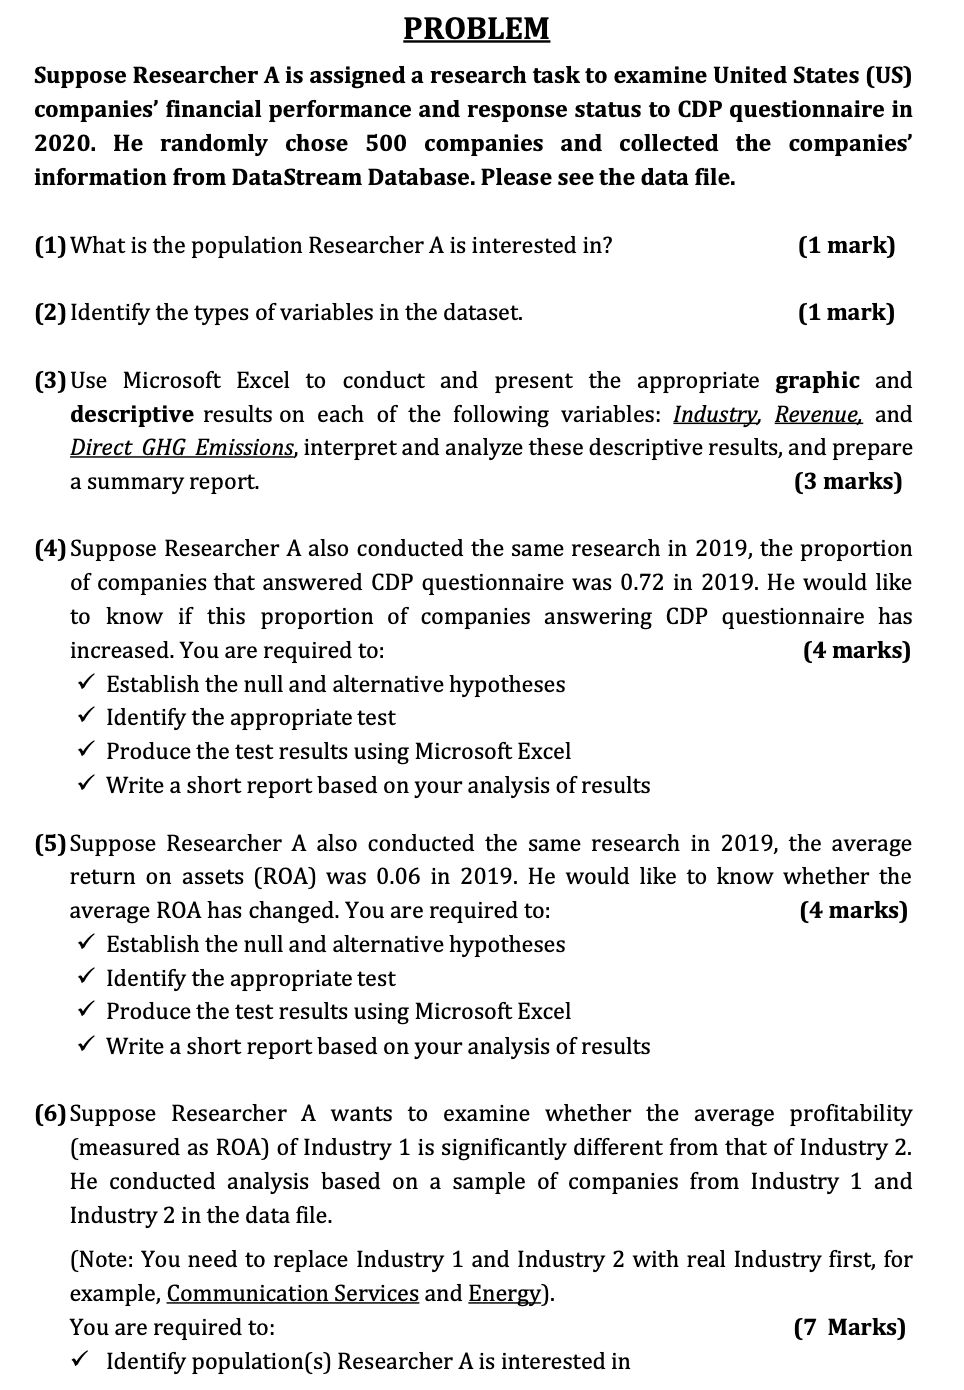
PROBLEM Suppose Researcher A is assigned a research task to examine United States (US) companies' nancial performance and response status to GDP questionnaire in 2020. He randomly chose 500 companies and collected the companies' information from DataStream Database. Please see the data le. [1) What is the population Researcher A is interested in? (1 mark) (2) Identify the types of variables in the dataset. [1 mark) [3) Use Microsoft Excel to conduct and present the appropriate graphic and descriptive results on each of the following variables: Magma, Revenue. and Direct GHG Emissions interpret and analyze these descriptive results, and prepare a summary report. [3 marks) [4-) Suppose Researcher A also conducted the same research in 2019, the proportion of companies that answered CDP questionnaire was 0.72 in 2019. He would like to know if this proportion of companies answering CDP questionnaire has increased. You are required to: [4 marks) 1 Establish the null and alternative hypotheses V\" Identify the appropriate test V Produce the test results using Microsoft Excel 1 Write a short report based on your analysis of results [5)Suppose Researcher A also conducted the same research in 2019, the average return on assets [RDA] was 0.06 in 2019. He would like to know whether the average ROA has changed. You are required to: [4- marks) I Establish the null and alternative hypotheses a/ Identify the appropriate test V Produce the test results using Microsoft Excel I Write a short report based on your analysis of results [6) Suppose Researcher A wants to examine whether the average protability (measured as RDA] of Industry 1 is signicantly different from that of Industry 2. He conducted analysis based on a sample of companies from Industry 1 and Industry 2 in the data le. (Note: You need to replace Industry 1 and Industry 2 with real Industry rst, for example, Communication Services and Energy). You are required to: ['7 Marks) ~/ Identify population(s] Researcher A is interested in