

Answered step by step
Verified Expert Solution
Question
1 Approved Answer
Problem The average time ( minutes ) that a customer has to wait for the arrival of a cab after calling the company has been
Problem
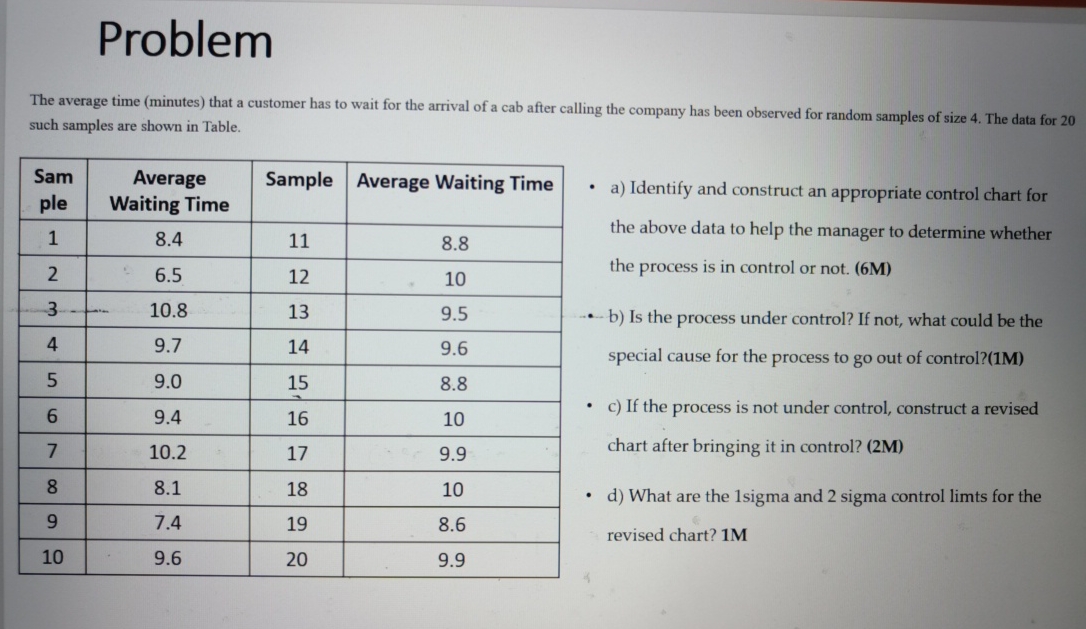
The average time minutes that a customer has to wait for the arrival of a cab after calling the company has been observed for random samples of size The data for such samples are shown in Table.
tabletableSampletableAverageWaiting TimeSample,Average Waiting Time
a Identify and construct an appropriate control chart for the above data to help the manager to determine whether the process is in control or not. M
b Is the process under control? If not, what could be the special cause for the process to go out of control?M
c If the process is not under control, construct a revised chart after bringing it in control? M
d What are the sigma and sigma control limts for the revised chart?
Step by Step Solution
There are 3 Steps involved in it
Step: 1

Get Instant Access to Expert-Tailored Solutions
See step-by-step solutions with expert insights and AI powered tools for academic success
Step: 2

Step: 3
Ace Your Homework with AI
Get the answers you need in no time with our AI-driven, step-by-step assistance
Get Started
Thermodynamics Concepts And Applications
Authors: Stephen R. Turns, Laura L. Pauley
2nd Edition
1107179718, 9781107179714