

Answered step by step
Verified Expert Solution
Question
1 Approved Answer
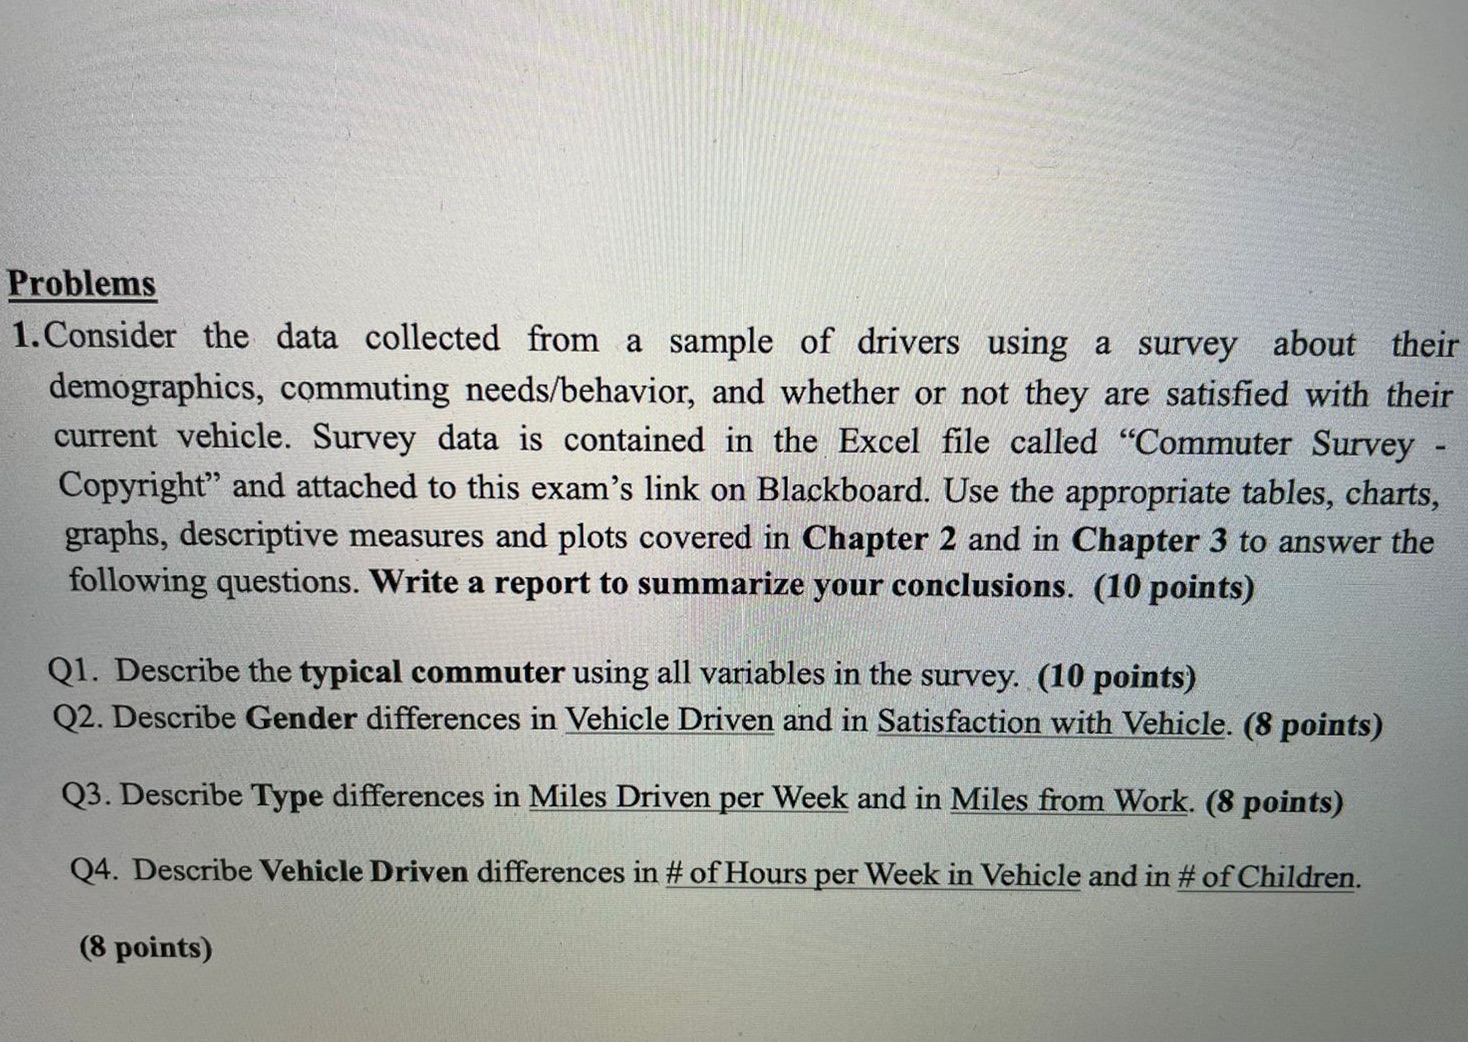
Problems 1. Consider the data collected from a sample of drivers using a survey about their demographics, commuting needs/behavior, and whether or not they are
Step by Step Solution
There are 3 Steps involved in it
Step: 1

Get Instant Access to Expert-Tailored Solutions
See step-by-step solutions with expert insights and AI powered tools for academic success
Step: 2

Step: 3
Ace Your Homework with AI
Get the answers you need in no time with our AI-driven, step-by-step assistance
Get Started
Trigonometry A Unit Circle Approach (Subscription)
Authors: Michael Sullivan, Michael Sullivan III
11th Edition
0135229693, 9780135229699