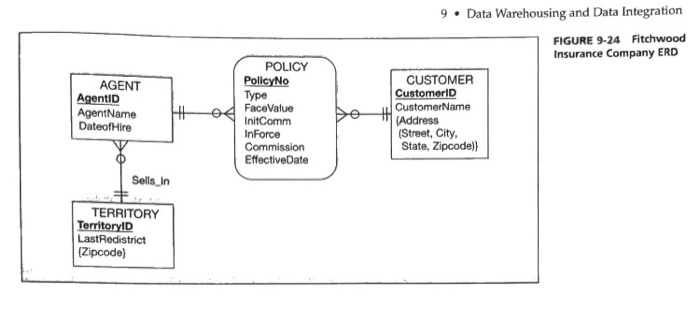
Problems 9-46 through 9-54 are based on the Fitchwood Insurance Company case study, which is described next. Fitchwood Insurance Company, which is involved pri- marily in the sale of annuity products, would like to design a data mart for its sales and marketing organi- zation. Presently, the OLTP system is a legacy system residing on a shared network drive consisting of approxi- mately 600 different flat files. For the purposes of our case study, you can assume that 30 different flat files are going to be used for the data mart. Some of these flat files are transaction files that change constantly. The OLTP system is shut down overnight on Friday evening beginning at 6 P.M. for backup. During that time, the flat files are cop- ied to another server, an extraction process is run, and the extracts are sent via FTP to a UNIX server. A process is run on the UNIX server to load the extracts into Oracle and rebuild the star schema. For the initial loading of the data mart, all information from the 30 files was extracted and loaded. On a weekly basis, only additions and updates will be included in the extracts. Although the data contained in the OLTP system are broad, the sales and marketing organization would like to focus on the sales data only. After substantial analysis, the ERD shown in Figure 9-24 was developed to describe the data to be used to populate the data mart. From this ERD, you get the set of relations shown in Fig- ure 9-25. Sales and marketing is interested in viewing all sales data by territory, effective date, type of policy, and face value. In addition, the data mart should be able to provide reporting by individual agent on sales as well as commis- sions earned. Occasionally, the sales territories are revised (i.e., zip codes are added or deleted). The Last Redistrict attri- bute of the Territory table is used to store the date of the last revision. Some sample queries and reports are listed here: Total sales per month by territory, by type of policy. Total sales per quarter by territory, by type of policy. Total sales per month by agent, by type of policy. Total sales per month by agent, by zip code. Total face value of policies by month of effective date. Total face value of policies by month of effective date, by agent. Total face value of policies by quarter of effective date. Total number of policies in force, by agent. Total number of policies not in force, by agent. Total face value of all policies sold by an individual agent. Total initial commission paid on all policies to an agent. Total initial commission paid on policies sold in a given month by agent. Total commissions earned by month, by agent. Top-selling agent by territory, by month. Commissions are paid to an agent on the initial sale of a policy. The InitComm field of the policy table contains the percent- age of the face value paid as an initial commission. The Com- mission field contains a percentage that is paid each month as long as a policy remains active or in force. Each month, com- missions are calculated by computing the sum of the commis- sion on each individual policy that is in force for an agent. 9. Data Warehousing and Data Integration FIGURE 9-24 Fitchwood Insurance Company ERD AGENT AgentID AgentName DateofHire POLICY PolicyNo Type H04 FaceValue InitComm InForce Commission EffectiveDate CUSTOMER CustomerID . CustomerName (Address (Street, City, State, Zipcode) Sells in TERRITORY TerritoryID LastRedistrict {Zipcode) 9-50. The OLTP system data for the Fitchwood Insurance Com- pany is in a series of flat files. What process do you envi- sion would be needed in order to extract the data and create the ERD shown in Figure 9-24? How often should


