Problems: K, L, and M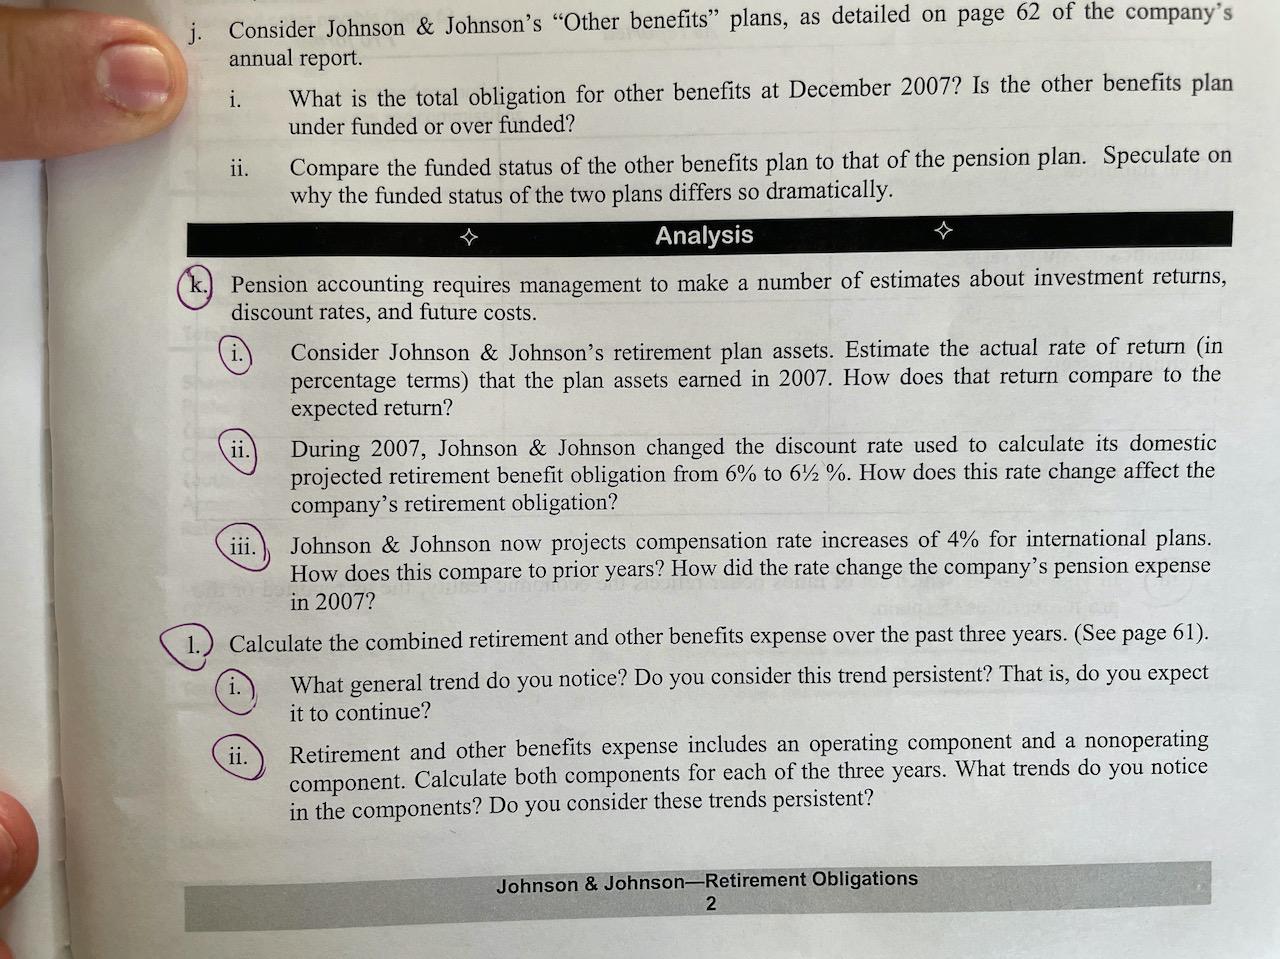

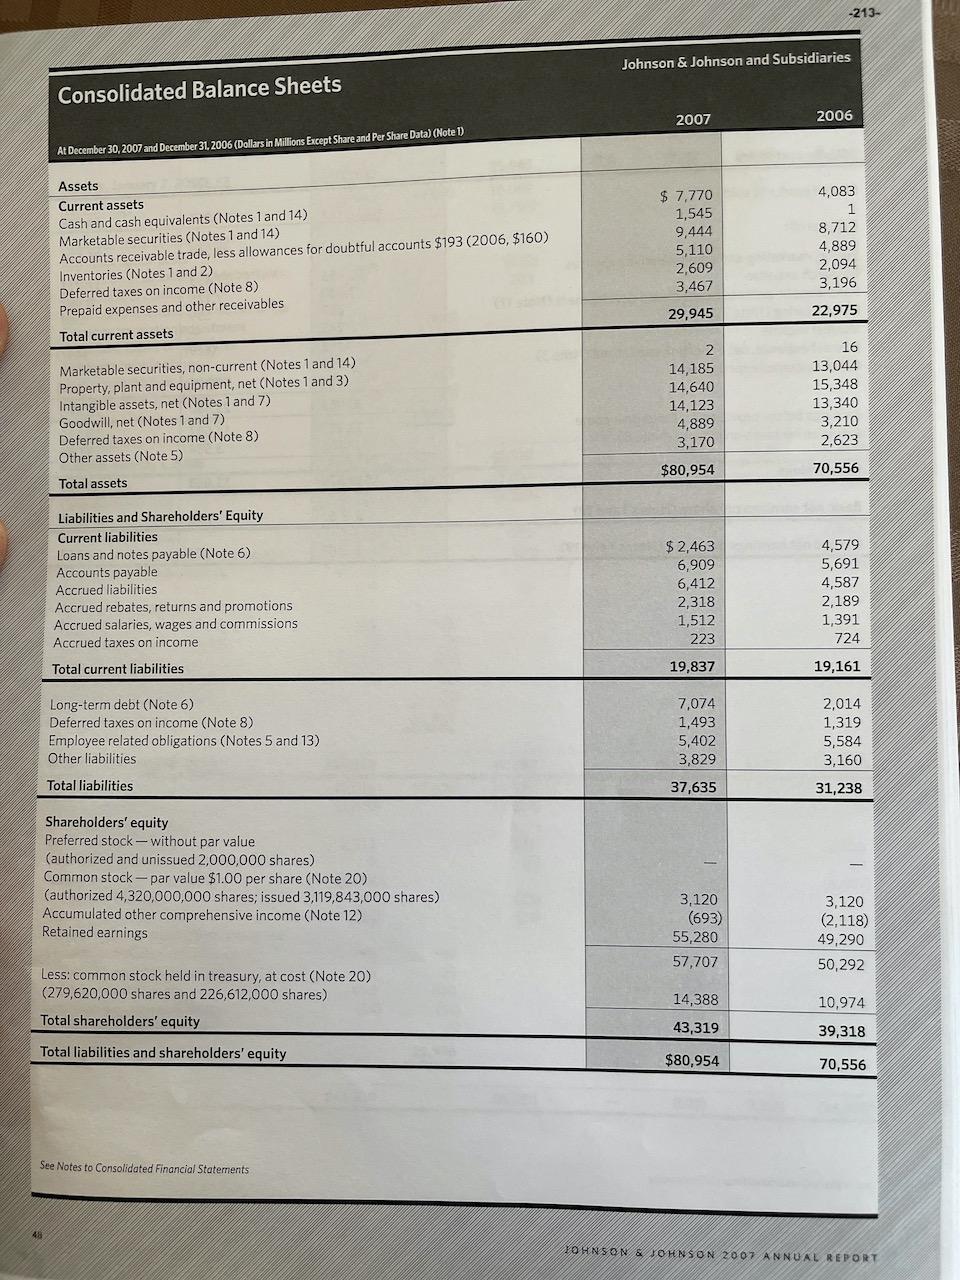
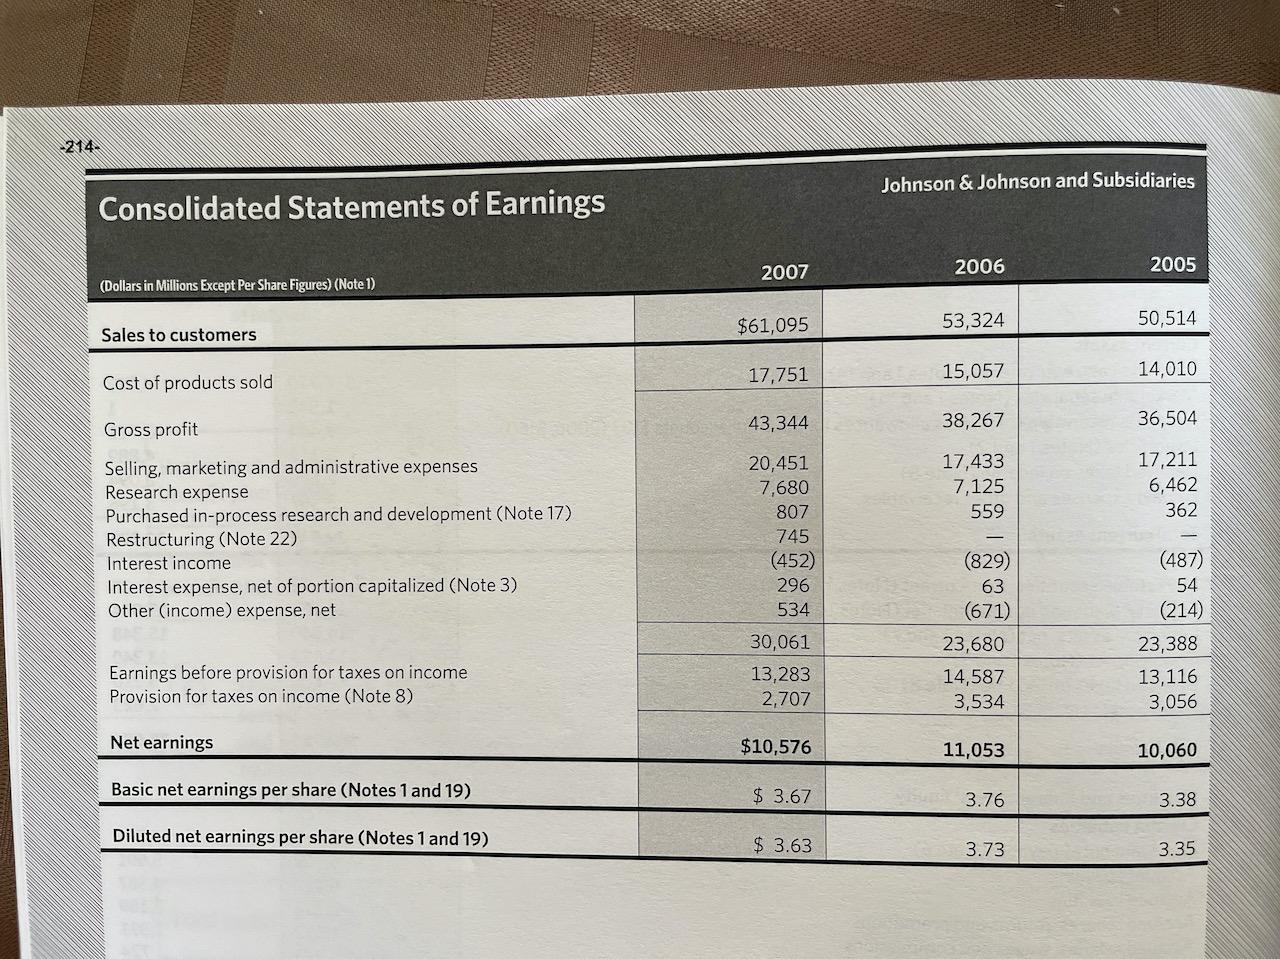
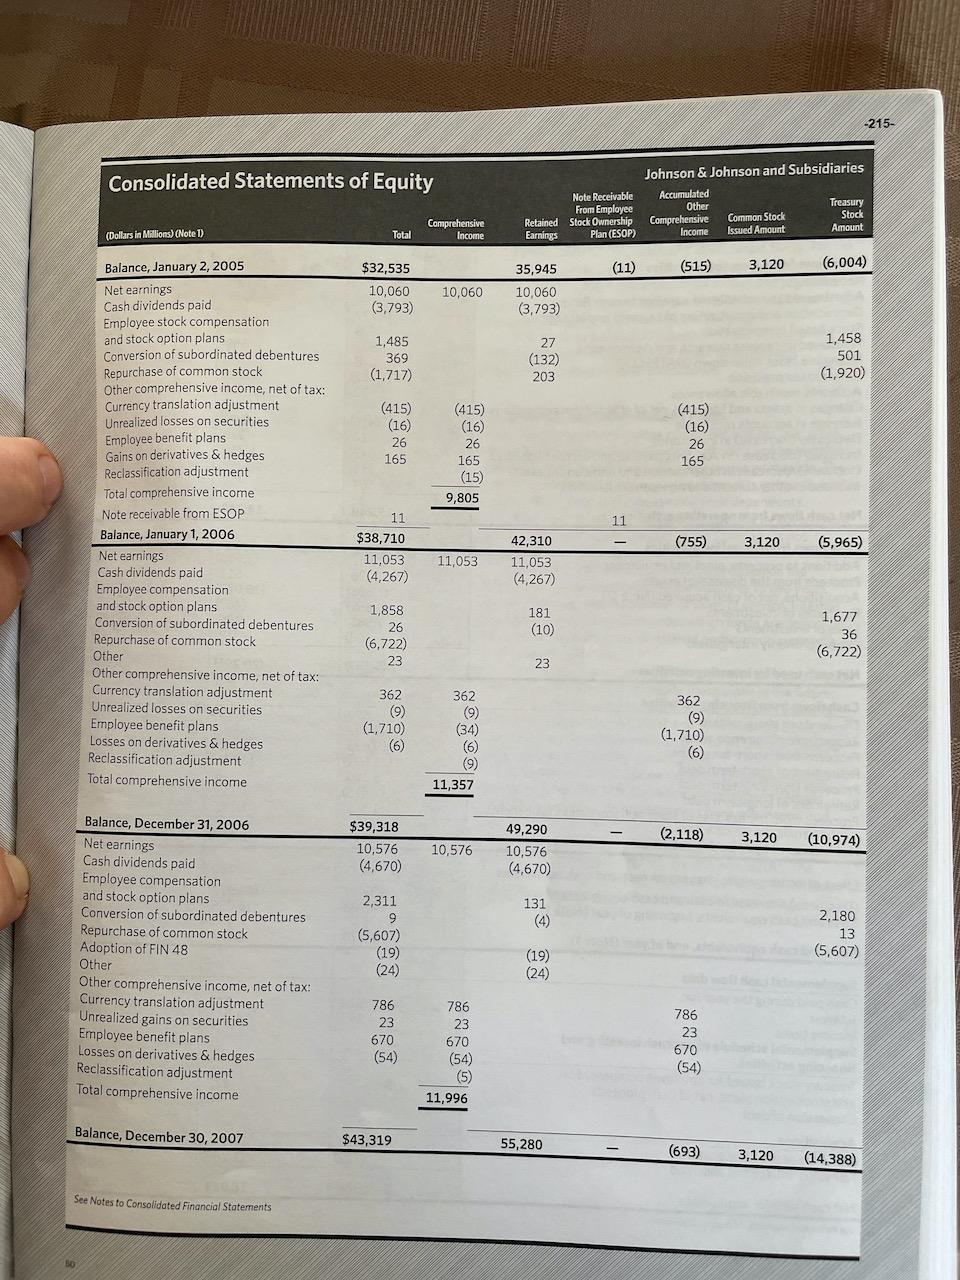
j. Consider Johnson & Johnson's "Other benefits plans, as detailed on page 62 of the company's annual report. i. What is the total obligation for other benefits at December 2007? Is the other benefits plan under funded or over funded? ii. Compare the funded status of the other benefits plan to that of the pension plan. Speculate on why the funded status of the two plans differs so dramatically. Analysis k. Pension accounting requires management to make a number of estimates about investment returns, discount rates, and future costs. Consider Johnson & Johnson's retirement plan assets. Estimate the actual rate of return (in percentage terms) that the plan assets earned in 2007. How does that return compare to the expected return? 11. During 2007, Johnson & Johnson changed the discount rate used to calculate its domestic projected retirement benefit obligation from 6% to 6%2%. How does this rate change affect the company's retirement obligation? iii. Johnson & Johnson now projects compensation rate increases of 4% for international plans. How does this compare to prior years? How did the rate change the company's pension expense in 2007? 1.) Calculate the combined retirement and other benefits expense over the past three years. (See page 61). What general trend do you notice? Do you consider this trend persistent? That is, do you expect it to continue? ii. Retirement and other benefits expense includes an operating component and a nonoperating component. Calculate both components for each of the three years. What trends do you notice in the components? Do you consider these trends persistent? Johnson & Johnson-Retirement Obligations 2 -212- (m) Under current U.S. GAAP, Johnson & Johnson includes on its balance sheet the net funded status of its retirement plans. Consider the balance sheet effects of instead including the gross assets of both the retirement plans and the other benefit plans and their respective gross obligations. Use the table below to show how total assets and total liabilities on the balance sheet would be affected. Gross amount that would be added Net amount currently included Net amount that would be added Retirement and other benefit plan assets Retirement and other benefit plan liabilities Determine the amounts and ratios below using Johnson & Johnson's reported numbers. Then, recompute the amounts and ratios on a pro forma basis taking into account the restated assets and liabilities you calculated in part i above. For purposes of these calculations, use year-end balance sheet numbers and assume that the company's marginal tax rate, as approximated by the combined federal and state statutory rates is 35%. As reported Pro forma Total assets Total liabilities Liabilities to equity ratio Return on assets Return on equity iii. In your opinion, which set of ratios better reflects the economic reality, the as reported or the pro forma ratios? Explain. Johnson & Johnson-Retirement Obligations -213- Johnson & Johnson and Subsidiaries Consolidated Balance Sheets 2007 2006 At December 30, 2007 and December 31, 2006 (Dollars in Millions Except Share and Per Share Data) (Note 1) Assets Current assets Cash and cash equivalents (Notes 1 and 14) Marketable securities (Notes 1 and 14) Accounts receivable trade, less allowances for doubtful accounts $193 (2006, $160) Inventories (Notes 1 and 2) Deferred taxes on income (Note 8) Prepaid expenses and other receivables Total current assets $ 7.770 1,545 9,444 5,110 2,609 3,467 4,083 1 8,712 4,889 2,094 3,196 29,945 22,975 Marketable securities, non-current (Notes 1 and 14) Property, plant and equipment, net (Notes 1 and 3) Intangible assets, net (Notes 1 and 7) Goodwill, net (Notes 1 and 7) Deferred taxes on income (Note 8) Other assets (Note 5) 2 14,185 14,640 14,123 4,889 3,170 16 13,044 15,348 13,340 3,210 2,623 $80,954 70,556 Total assets Liabilities and Shareholders' Equity Current liabilities Loans and notes payable (Note 6) Accounts payable Accrued liabilities Accrued rebates, returns and promotions Accrued salaries, wages and commissions Accrued taxes on income $ 2,463 6,909 6,412 2,318 1,512 223 4,579 5,691 4,587 2,189 1,391 724 Total current liabilities 19,837 19,161 Long-term debt (Note 6) Deferred taxes on income (Note 8) Employee related obligations (Notes 5 and 13) Other liabilities 7,074 1,493 5,402 3,829 2,014 1,319 5,584 3,160 Total liabilities 37,635 31,238 Shareholders' equity Preferred stock -- without par value (authorized and unissued 2,000,000 shares) Common stock - par value $1.00 per share (Note 20) (authorized 4,320,000,000 shares; issued 3,119,843,000 shares) Accumulated other comprehensive income (Note 12) Retained earnings 3,120 (693) 55,280 57,707 3,120 (2,118) 49,290 50,292 Less: common stock held in treasury, at cost (Note 20) (279,620,000 shares and 226,612,000 shares) Total shareholders' equity 14,388 10,974 43,319 39,318 Total liabilities and shareholders' equity $80,954 70,556 See Notes to Consolidated Financial Statements IOHNSON & JOHNSON 2007 ANNUAL REPORT 214. Johnson & Johnson and Subsidiaries Consolidated Statements of Earnings 2007 2006 2005 (Dollars in Millions Except Per Share Figures) (Note 1) $61,095 53,324 50,514 Sales to customers 17,751 15,057 14,010 Cost of products sold 43,344 38,267 36,504 Gross profit 17,433 7,125 559 17,211 6,462 362 Selling, marketing and administrative expenses Research expense Purchased in-process research and development (Note 17) Restructuring (Note 22) Interest income Interest expense, net of portion capitalized (Note 3) Other (income) expense, net 20,451 7,680 807 745 (452) 296 534 (829) 63 (671) 23,680 14,587 3,534 (487) 54 (214) 23,388 13,116 3,056 Earnings before provision for taxes on income Provision for taxes on income (Note 8) 30,061 13,283 2,707 Net earnings $10,576 11,053 10,060 Basic net earnings per share (Notes 1 and 19) $ 3.67 3.76 3.38 Diluted net earnings per share (Notes 1 and 19) $ 3.63 3.73 3.35 -215- Consolidated Statements of Equity Johnson & Johnson and Subsidiaries Accumulated Other Treasury Comprehensive Common Stock Stock Income Issued Amount Amount Note Receivable From Employee Retained Stock Ownership Earnings Plan (ESOP) (Dollars in Millions) (Note 1) Comprehensive Income Total (11) (515) 3,120 (6,004) $32,535 10,060 (3,793) 10,060 35,945 10,060 (3,793) 1,485 369 (1.717) 27 (132) 203 1,458 501 (1,920) (415) (16) 26 165 (415) (16) 26 165 (15) 9,805 (415) (16) 26 165 Balance, January 2, 2005 Net earnings Cash dividends paid Employee stock compensation and stock option plans Conversion of subordinated debentures Repurchase of common stock Other comprehensive income, net of tax: Currency translation adjustment Unrealized losses on securities Employee benefit plans Gains on derivatives & hedges Reclassification adjustment Total comprehensive income Note receivable from ESOP Balance, January 1, 2006 Net earnings Cash dividends paid Employee compensation and stock option plans Conversion of subordinated debentures Repurchase of common stock Other Other comprehensive income, net of tax: Currency translation adjustment Unrealized losses on securities Employee benefit plans Losses on derivatives & hedges Reclassification adjustment Total comprehensive income 11 (755) 3,120 11 $38,710 11,053 (4,267) (5,965) 11,053 42,310 11,053 (4,267) 1,858 26 (6,722) 23 181 (10) 1,677 36 (6,722) 23 362 (9) (1.710) 362 (9) (34) 362 (9) (1,710) (6) 9) 11,357 $39,318 10,576 (2,118) 3,120 (10,974) 10,576 49,290 10,576 (4,670) (4,670) 131 Balance, December 31, 2006 Net earnings Cash dividends paid Employee compensation and stock option plans Conversion of subordinated debentures Repurchase of common stock Adoption of FIN 48 Other Other comprehensive income, net of tax: Currency translation adjustment Unrealized gains on securities Employee benefit plans Losses on derivatives & hedges Reclassification adjustment Total comprehensive income 2,311 9 (5,607) (19) (24) 2,180 13 (5,607) (19) (24) 786 23 670 (54) 786 23 670 (54) (5) 11,996 786 23 670 (54) Balance, December 30, 2007 $43,319 55,280 (693) 3,120 (14,388) See Notes to Consolidated Financial Statements Johnson & Johnson and Subsidiaries -216- Consolidated Statements of Cash Flows 2005 2006 2007 (Dollars in Millions) (Note D 10,060 11,053 $ 10,576 2,177 659 2,093 540 362 559 2,777 698 807 678 (1,762) 22 (1,168) (14) (235) (31) Cash flows from operating activities Net earnings Adjustments to reconcile net earnings to cash flows: Depreciation and amortization of property and intangibles Stock based compensation Purchased in-process research and development Intangible asset write-down (NATRECOR) Deferred tax provision Accounts receivable allowances Changes in assets and liabilities, net of effects from acquisitions: Increase in accounts receivable Decrease/Cincrease) in inventories Increase/(decrease) in accounts payable and accrued liabilities (Increase)/decrease in other current and non-current assets Increase in other current and non-current liabilities (416) 14 2,642 (1,351) 564 (699) (210) 1,750 (269) 410 (568) (396) (911) 542 343 14,248 11,799 15,249 Net cash flows from operating activities Cash flows from investing activities Additions to property, plant and equipment Proceeds from the disposal of assets Acquisitions, net of cash acquired (Note 17) Purchases of investments Sales of investments Other (primarily intangibles) Net cash used by investing activities (2,942) 230 (1,388) 9,659) 7,988 (368) (2,666) 511 (18,023) (467) 426 (72) (2,632) 154 (987) (5,660) 9,187 (341) (6,139) (20,291) (279) Cash flows from financing activities Dividends to shareholders Repurchase of common stock Proceeds from short-term debt Retirement of short-term debt Proceeds from long-term debt Retirement of long-term debt Proceeds from the exercise of stock options/excess tax benefits (4,670) (5,607) 19,626 (21,691) 5,100 (18) 1,562 (4,267) (6,722) 6,385 (2,633) 6 (13) 1,135 (3,793) (1,717) 1,215 (732) 6 (196) 774 Net cash used by financing activities (5,698) (6,109) (4,443) Effect of exchange rate changes on cash and cash equivalents (Decrease) /increase in cash and cash equivalents Cash and cash equivalents, beginning of year (Note 1) Cash and cash equivalents, end of year (Note 1) 275 3,687 4,083 180 (11,972) 16,055 (225) 6,852 9,203 $ 7,770 4,083 16,055 $ 314 4,099 143 4,250 151 3,429 Supplemental cash flow data Cash paid during the year for: Interest Income taxes Supplemental schedule of noncash investing and financing activities Treasury stock issued for employee compensation and stock option plans, net of cash proceeds Conversion of debt Acquisitions Fair value of assets acquired Fair value of liabilities assumed $ 738 9 622 26 818 369 $ 1,620 (232) 19,306 (1,283) 1,128 (141) Net cash paid for acquisitions See Notes to Consolidated Financial Statements $ 1,388 18,023 987 CONSOLIDATED FINANCIAL STATEMENTS -217- 12. Accumulated Other Comprehensive Income Components of other comprehensive income/(loss) consist of the following: The tax effect on the unrealized gains/Closses) on the equity securities balance is an expense of $46 million, $33 million and $38 million in 2007, 2006 and 2005, respectively. The tax effect related to employee benefit plans was $349 million, $891 million and $160 million in 2007, 2006 and 2005, respectively. The tax effect on the gains/(losses) on derivatives and hedges are gains of $24 million in 2007, and losses of $4 million and $11 million in 2006 and 2005, respectively. See Note 15 for additional information relating to derivatives and hedging. The currency translation adjustments are not currently adjusted for income taxes as they relate to permanent investments in international subsidiaries. Total Unrealized Gains/ Accumulated Foreign Gains/ (Losses) on Other Currency (Losses) on Employee Derivatives Comprehensive (Dollars in Millions) Translation Securities Benefit Plans & Hedges Income/(Loss) Jan. 2. 2005 $(105) 86 (346) (150) (515) 2005 changes Net change due to hedging transactions 112 Net amount reclassed to net earnings 53 Net 2005 changes (415) (16) 26 165 (240) Jan. 1.2006 $(520) 70 (320) 15 (755) 2006 changes Net change due to hedging transactions 17 Net amount reclassed to net earnings (23) Net 2006 changes 362 (9) (1,710) (6) (1,363) $(158) Dec 31, 2006 61 9 (2,030) (2,118) 2007 changes Net change due to hedging transactions (78) Net amount reclassed to net earnings 24 Net 2007 changes 786 23 670 (54) 1,425 Dec. 30, 2007 $ 628 84 (1,360) (45) (693) 13. Pensions and Other Benefit Plans The Company sponsors various retirement and pension plans, including defined benefit, defined contribution and termination indemnity plans, which cover most employees worldwide. The Company also provides postretirement benefits, primarily health care, to all U.S. retired employees and their dependents. Many international employees are covered by government- sponsored programs and the cost to the Company is not significant Retirement plan benefits are primarily based on the employee's compensation during the last three to five years before retirement and the number of years of service. Interna- tional subsidiaries have plans under which funds are deposited with trustees, annuities are purchased under group contracts, or reserves are provided. The Company does not fund retiree health care benefits in advance and has the right to modify these plans in the future. The Company uses the date of its consolidated financial statements (December 30, 2007 and December 31, 2006, respectively) as the measurement date for all U.S. and interna- tional retirement and other benefit plans. In September 2006, Statement of Financial Accounting Standards (SFAS) No. 158, Employers' Accounting for Defined Benefit Pension and Other Postretirement Plans was issued and amends further the disclosure requirements for pensions and other postretirement benefits. This Statement was an amend- ment of FASB Statements No. 87, 88, 106 and 132(R). The incremental effect of applying FASB No. 158 was a $1.7 billion reduction in Shareholder's Equity, net of deferred taxes. Total comprehensive income for 2007 includes reclassification adjustment gains of $7 million realized from the sale of equity securities and the associated tax expense of $2 million. Total other comprehensive income for 2006 includes reclassifi- cation adjustment gains of $13 million realized from the sale of equity securities and the associated tax expense of $4 million. Total other comprehensive income for 2005 includes reclassifi- cation adjustment gains of $23 million realized from the sale of equity securities and the associated tax expense of $8 million JOHNSON & JOHNSON 2007 ANNUAL REPORT Net periodic benefit costs for the Company's defined benefit retirement plans and other benefit plans for 2007, 2006 and 2005 include the following components: Other Benefit Plans 2007 2006 $140 122 149 136 (2) (3) 2005 56 Retirement Plans 2007 2006 $ 597 552 656 570 (809) (701) 10 10 1 (1) 186 251 5 4 $ 646 685 (Dollars in Millions) Service cost Interest cost Expected return on plan assets Amortization of prior service cost Amortization of net transition asset Recognized actuarial losses Curtailments and settlements Net periodic benefit cost 2005 462 488 (579) 12 (2) 219 2 602 87 (3) (7) 190 66 74 25 $346 322 158 The net periodic benefit cost attributable to U.S. retirement plans was $379 million in 2007, $423 million in 2006 and $370 million in 2005. Amounts expected to be recognized in net periodic benefit cost in the coming year for the Company's defined benefit retirement plans and other postretirement plans: (Dollars in Millions) Amortization of net transition obligation Amortization of net actuarial losses Amortization of prior service cost $ 2 132 5 The weighted-average assumptions in the following table represent the rates used to develop the actuarial present value of projected benefit obligation for the year listed and also the net periodic benefit cost for the following year. Retirement Plans 2006 Other Benefit Plans 2007 2006 2007 2005 2005 6.50% 6.00 5.75 6.50% 6.00 5.75 9.00 (Dollars in Millions) U.S. Benefit Plans Discount rate Expected long-term rate of return on plan assets Rate of increase in compensation levels International Benefit Plans Discount rate Expected long-term rate of return on plan assets Rate of increase in compensation levels 9.00 4.50 9.00 4.50 9.00 4.50 9.00 4.50 4.50 9.00 4.50 5.50% 5.00 4.75 6.50% 6.00 5.00 8.25 4.00 8.00 3.75 8.25 3.75 4.50 4.50 4.25 The following table displays the assumed health care cost trend rates, for all individuals: The Company's discount rates are determined by considering current yield curves representing high quality, long-term fixed income instru- ments. The resulting discount rates are consistent with the duration of plan liabilities. The expected long-term rate of return on plan assets assumption is determined using a building block approach, con- sidering historical averages and real returns of each asset class. In certain countries, where historical returns are not meaningful, consideration is given to local market expectations of long-term returns. 2007 9.00% 2006 9.00 Health Care Plans Health care cost trend rate assumed for next year Rate to which the cost trend rate is assumed to decline (ultimate trend) Year the rate reaches the ultimate trend rate 5.00% 2014 4.50 2012 A one-percentage-point change in assumed health care cost trend rates would have the following effect: One-Percentage Point Increase One-Percentage- Point Decrease (Dollars in Millions) Health Care Plans Total interest and service cost Postretirement benefit obligation $ 35 320 $ (27) (259) HOTES TO CONSOLIDATED FINANCIAL STATEMENTS -219- The following table sets forth information related to the benefit obligation and the fair value of plan assets at year-end 2007 and 2006 for the Company's defined benefit retirement plans and other postretirement plans: Retirement Plans 2007 2006 Other Benefit Plans 2007 2006 2,325 122 136 11 $11,660 597 656 62 14 (876) 79 (46) (481) 337 $12,002 10,171 $ 2,668 552 140 570 149 47 7 (99) (1) 443 8 (7) (402) (255) 378 12 11,660 $ 2,721 130 101 (147) 1 2,668 966 34 2 141 259 (Dollars in Millions) Change in Benefit Obligation Projected benefit obligation - beginning of year Service cost Interest cost Plan participant contributions Amendments Actuarial (gains) losses Divestitures & acquisitions Curtailments & settlements Benefits paid from plan Effect of exchange rates Projected benefit obligation -- end of year Change in Plan Assets Plan assets at fair value - beginning of year Actual return on plan assets Company contributions Plan participant contributions Settlements Divestitures & acquisitions Benefits paid from plan assets Effect of exchange rates Plan assets at fair value -- end of year Funded status at -- end of year Amounts Recognized in the Company's Balance Sheet consist of the following: Non-current assets Current liabilities Non-current liabilities Total recognized in the consolidated balance sheet -- end of year Amounts Recognized in Accumulated Other Comprehensive Income consist of the following: Net actuarial loss (gain) Prior service cost (credit) Unrecognized net transition asset Total before tax effects Accumulated Benefit Obligations - end of year Changes in Plan Assets and Benefit Obligations Recognized in Other Comprehensive Income Net periodic benefit cost Net actuarial loss (gain) Amortization of net actuarial loss Prior service cost Amortization of prior service cost Effect of exchange rates Total recognized in other comprehensive income, before tax Total recognized in net periodic benefit cost and other comprehensive income $9,538 743 317 62 (38) 55 (481) 273 $10,469 $ (1,533) 8,108 30 4 250 47 (7) 300 (402) (255) 267 9,538 $ 29 (2,122) $(2,692) (147) 30 (2,638) $ 481 (43) (1,971) $ (1,533) (2,355) 259 (26) (262) (2,430) (2,122) $(2,692) (81) (2,557) (2,638) 1,046 (42) $ 1,027 51 7 $ 1,085 $10,282 1,996 $ 1,013 44 (36) 7 2,047 $ 977 9,804 1,004 $ 646 (555) (435) (9) 14 23 $ (962) $ (316) $ 346 11 (13) (34) 6 3 $ (27) $ 319 Plans with accumulated benefit obligations in excess of plan assets consist of the following: (Dollars in Millions) Accumulated benefit obligation Projected benefit obligation Plan assets at fair value Retirement Plans 2007 2006 $(4,914) (3,085) (5,233) (3,561) 3,735 1,650 220- allocations are consistent with these types of plans. Emphasis is Strategic asset allocations are determined by country, based on the nature of the liabilities and considering the demographic placed on diversifying equities on a broad basis combined with composition of the plan participants (average age, years of ser- currency matching of the fixed income assets. vice and active versus retiree status). The Company's plans are considered non-mature plans and the long-term strategic asset The following table displays the projected future benefit payments from the Company's retirement and other benefit plans: 2008 2010 2009 2011 2012 (Dollars in Millions) 2013-2017 Projected future benefit payments Retirement plans $457 472 507 542 564 3,467 Other benefit plans-gross $274 180 184 188 192 1,080 Medicare rebates (9) (11) (12) (13) (14) (94) Other benefit plans-net $265 $169 $172 $175 $178 $986 The Company was not required to fund its U.S. retirement plans appropriate to meet the long-term obligations of the plans. In in 2007 and is not required, nor does it anticipate funding in certain countries other than the United States, the funding of 2008 to meet minimum statutory funding requirements. Inter- pension plans is not a common practice as funding provides no national plans are funded in accordance with local regulations. economic benefit. Consequently the Company has several pen- Additional discretionary contributions are made when deemed sion plans which are not funded. The following table displays the projected future minimum contributions to the Company's U.S. and international unfunded retirement plans. These amounts do not include any discretionary contributions that the Company may elect to make in the future. (Dollars in Millions) 2008 2009 2010 2011 2012 2013-2017 Projected future contributions Unfunded U.S. retirement plans $28 30 33 35 38 238 Unfunded International retirement plans $23 25 28 29 31 178 The Company's retirement plan asset allocation at the end of 2007 and 2006 and target allocations for 2008 are as follows: Percent of Plan Assets 2007 Target Allocation 2008 2006 79% 21 100% 78% 22 100% 75% 25 100% U.S. Retirement Plans Equity securities Debt securities Total plan assets International Retirement Plans Equity securities Debt securities Real estate and other Total plan assets 67% 32 67% 33 67% 32 1 100% 100% 100% The Company's other benefit plans are unfunded except for U.S. life insurance contract assets of $29 million and $30 million at December 30, 2007 and December 31, 2006, respectively. The fair value of Johnson & Johnson common stock directly held in plan assets was $462 million (4.4% of total plan assets) at December 30, 2007 and $452 million (4.9% of total plan assets) at December 31, 2006. NOTES TO CONSOLAT j. Consider Johnson & Johnson's "Other benefits plans, as detailed on page 62 of the company's annual report. i. What is the total obligation for other benefits at December 2007? Is the other benefits plan under funded or over funded? ii. Compare the funded status of the other benefits plan to that of the pension plan. Speculate on why the funded status of the two plans differs so dramatically. Analysis k. Pension accounting requires management to make a number of estimates about investment returns, discount rates, and future costs. Consider Johnson & Johnson's retirement plan assets. Estimate the actual rate of return (in percentage terms) that the plan assets earned in 2007. How does that return compare to the expected return? 11. During 2007, Johnson & Johnson changed the discount rate used to calculate its domestic projected retirement benefit obligation from 6% to 6%2%. How does this rate change affect the company's retirement obligation? iii. Johnson & Johnson now projects compensation rate increases of 4% for international plans. How does this compare to prior years? How did the rate change the company's pension expense in 2007? 1.) Calculate the combined retirement and other benefits expense over the past three years. (See page 61). What general trend do you notice? Do you consider this trend persistent? That is, do you expect it to continue? ii. Retirement and other benefits expense includes an operating component and a nonoperating component. Calculate both components for each of the three years. What trends do you notice in the components? Do you consider these trends persistent? Johnson & Johnson-Retirement Obligations 2 -212- (m) Under current U.S. GAAP, Johnson & Johnson includes on its balance sheet the net funded status of its retirement plans. Consider the balance sheet effects of instead including the gross assets of both the retirement plans and the other benefit plans and their respective gross obligations. Use the table below to show how total assets and total liabilities on the balance sheet would be affected. Gross amount that would be added Net amount currently included Net amount that would be added Retirement and other benefit plan assets Retirement and other benefit plan liabilities Determine the amounts and ratios below using Johnson & Johnson's reported numbers. Then, recompute the amounts and ratios on a pro forma basis taking into account the restated assets and liabilities you calculated in part i above. For purposes of these calculations, use year-end balance sheet numbers and assume that the company's marginal tax rate, as approximated by the combined federal and state statutory rates is 35%. As reported Pro forma Total assets Total liabilities Liabilities to equity ratio Return on assets Return on equity iii. In your opinion, which set of ratios better reflects the economic reality, the as reported or the pro forma ratios? Explain. Johnson & Johnson-Retirement Obligations -213- Johnson & Johnson and Subsidiaries Consolidated Balance Sheets 2007 2006 At December 30, 2007 and December 31, 2006 (Dollars in Millions Except Share and Per Share Data) (Note 1) Assets Current assets Cash and cash equivalents (Notes 1 and 14) Marketable securities (Notes 1 and 14) Accounts receivable trade, less allowances for doubtful accounts $193 (2006, $160) Inventories (Notes 1 and 2) Deferred taxes on income (Note 8) Prepaid expenses and other receivables Total current assets $ 7.770 1,545 9,444 5,110 2,609 3,467 4,083 1 8,712 4,889 2,094 3,196 29,945 22,975 Marketable securities, non-current (Notes 1 and 14) Property, plant and equipment, net (Notes 1 and 3) Intangible assets, net (Notes 1 and 7) Goodwill, net (Notes 1 and 7) Deferred taxes on income (Note 8) Other assets (Note 5) 2 14,185 14,640 14,123 4,889 3,170 16 13,044 15,348 13,340 3,210 2,623 $80,954 70,556 Total assets Liabilities and Shareholders' Equity Current liabilities Loans and notes payable (Note 6) Accounts payable Accrued liabilities Accrued rebates, returns and promotions Accrued salaries, wages and commissions Accrued taxes on income $ 2,463 6,909 6,412 2,318 1,512 223 4,579 5,691 4,587 2,189 1,391 724 Total current liabilities 19,837 19,161 Long-term debt (Note 6) Deferred taxes on income (Note 8) Employee related obligations (Notes 5 and 13) Other liabilities 7,074 1,493 5,402 3,829 2,014 1,319 5,584 3,160 Total liabilities 37,635 31,238 Shareholders' equity Preferred stock -- without par value (authorized and unissued 2,000,000 shares) Common stock - par value $1.00 per share (Note 20) (authorized 4,320,000,000 shares; issued 3,119,843,000 shares) Accumulated other comprehensive income (Note 12) Retained earnings 3,120 (693) 55,280 57,707 3,120 (2,118) 49,290 50,292 Less: common stock held in treasury, at cost (Note 20) (279,620,000 shares and 226,612,000 shares) Total shareholders' equity 14,388 10,974 43,319 39,318 Total liabilities and shareholders' equity $80,954 70,556 See Notes to Consolidated Financial Statements IOHNSON & JOHNSON 2007 ANNUAL REPORT 214. Johnson & Johnson and Subsidiaries Consolidated Statements of Earnings 2007 2006 2005 (Dollars in Millions Except Per Share Figures) (Note 1) $61,095 53,324 50,514 Sales to customers 17,751 15,057 14,010 Cost of products sold 43,344 38,267 36,504 Gross profit 17,433 7,125 559 17,211 6,462 362 Selling, marketing and administrative expenses Research expense Purchased in-process research and development (Note 17) Restructuring (Note 22) Interest income Interest expense, net of portion capitalized (Note 3) Other (income) expense, net 20,451 7,680 807 745 (452) 296 534 (829) 63 (671) 23,680 14,587 3,534 (487) 54 (214) 23,388 13,116 3,056 Earnings before provision for taxes on income Provision for taxes on income (Note 8) 30,061 13,283 2,707 Net earnings $10,576 11,053 10,060 Basic net earnings per share (Notes 1 and 19) $ 3.67 3.76 3.38 Diluted net earnings per share (Notes 1 and 19) $ 3.63 3.73 3.35 -215- Consolidated Statements of Equity Johnson & Johnson and Subsidiaries Accumulated Other Treasury Comprehensive Common Stock Stock Income Issued Amount Amount Note Receivable From Employee Retained Stock Ownership Earnings Plan (ESOP) (Dollars in Millions) (Note 1) Comprehensive Income Total (11) (515) 3,120 (6,004) $32,535 10,060 (3,793) 10,060 35,945 10,060 (3,793) 1,485 369 (1.717) 27 (132) 203 1,458 501 (1,920) (415) (16) 26 165 (415) (16) 26 165 (15) 9,805 (415) (16) 26 165 Balance, January 2, 2005 Net earnings Cash dividends paid Employee stock compensation and stock option plans Conversion of subordinated debentures Repurchase of common stock Other comprehensive income, net of tax: Currency translation adjustment Unrealized losses on securities Employee benefit plans Gains on derivatives & hedges Reclassification adjustment Total comprehensive income Note receivable from ESOP Balance, January 1, 2006 Net earnings Cash dividends paid Employee compensation and stock option plans Conversion of subordinated debentures Repurchase of common stock Other Other comprehensive income, net of tax: Currency translation adjustment Unrealized losses on securities Employee benefit plans Losses on derivatives & hedges Reclassification adjustment Total comprehensive income 11 (755) 3,120 11 $38,710 11,053 (4,267) (5,965) 11,053 42,310 11,053 (4,267) 1,858 26 (6,722) 23 181 (10) 1,677 36 (6,722) 23 362 (9) (1.710) 362 (9) (34) 362 (9) (1,710) (6) 9) 11,357 $39,318 10,576 (2,118) 3,120 (10,974) 10,576 49,290 10,576 (4,670) (4,670) 131 Balance, December 31, 2006 Net earnings Cash dividends paid Employee compensation and stock option plans Conversion of subordinated debentures Repurchase of common stock Adoption of FIN 48 Other Other comprehensive income, net of tax: Currency translation adjustment Unrealized gains on securities Employee benefit plans Losses on derivatives & hedges Reclassification adjustment Total comprehensive income 2,311 9 (5,607) (19) (24) 2,180 13 (5,607) (19) (24) 786 23 670 (54) 786 23 670 (54) (5) 11,996 786 23 670 (54) Balance, December 30, 2007 $43,319 55,280 (693) 3,120 (14,388) See Notes to Consolidated Financial Statements Johnson & Johnson and Subsidiaries -216- Consolidated Statements of Cash Flows 2005 2006 2007 (Dollars in Millions) (Note D 10,060 11,053 $ 10,576 2,177 659 2,093 540 362 559 2,777 698 807 678 (1,762) 22 (1,168) (14) (235) (31) Cash flows from operating activities Net earnings Adjustments to reconcile net earnings to cash flows: Depreciation and amortization of property and intangibles Stock based compensation Purchased in-process research and development Intangible asset write-down (NATRECOR) Deferred tax provision Accounts receivable allowances Changes in assets and liabilities, net of effects from acquisitions: Increase in accounts receivable Decrease/Cincrease) in inventories Increase/(decrease) in accounts payable and accrued liabilities (Increase)/decrease in other current and non-current assets Increase in other current and non-current liabilities (416) 14 2,642 (1,351) 564 (699) (210) 1,750 (269) 410 (568) (396) (911) 542 343 14,248 11,799 15,249 Net cash flows from operating activities Cash flows from investing activities Additions to property, plant and equipment Proceeds from the disposal of assets Acquisitions, net of cash acquired (Note 17) Purchases of investments Sales of investments Other (primarily intangibles) Net cash used by investing activities (2,942) 230 (1,388) 9,659) 7,988 (368) (2,666) 511 (18,023) (467) 426 (72) (2,632) 154 (987) (5,660) 9,187 (341) (6,139) (20,291) (279) Cash flows from financing activities Dividends to shareholders Repurchase of common stock Proceeds from short-term debt Retirement of short-term debt Proceeds from long-term debt Retirement of long-term debt Proceeds from the exercise of stock options/excess tax benefits (4,670) (5,607) 19,626 (21,691) 5,100 (18) 1,562 (4,267) (6,722) 6,385 (2,633) 6 (13) 1,135 (3,793) (1,717) 1,215 (732) 6 (196) 774 Net cash used by financing activities (5,698) (6,109) (4,443) Effect of exchange rate changes on cash and cash equivalents (Decrease) /increase in cash and cash equivalents Cash and cash equivalents, beginning of year (Note 1) Cash and cash equivalents, end of year (Note 1) 275 3,687 4,083 180 (11,972) 16,055 (225) 6,852 9,203 $ 7,770 4,083 16,055 $ 314 4,099 143 4,250 151 3,429 Supplemental cash flow data Cash paid during the year for: Interest Income taxes Supplemental schedule of noncash investing and financing activities Treasury stock issued for employee compensation and stock option plans, net of cash proceeds Conversion of debt Acquisitions Fair value of assets acquired Fair value of liabilities assumed $ 738 9 622 26 818 369 $ 1,620 (232) 19,306 (1,283) 1,128 (141) Net cash paid for acquisitions See Notes to Consolidated Financial Statements $ 1,388 18,023 987 CONSOLIDATED FINANCIAL STATEMENTS -217- 12. Accumulated Other Comprehensive Income Components of other comprehensive income/(loss) consist of the following: The tax effect on the unrealized gains/Closses) on the equity securities balance is an expense of $46 million, $33 million and $38 million in 2007, 2006 and 2005, respectively. The tax effect related to employee benefit plans was $349 million, $891 million and $160 million in 2007, 2006 and 2005, respectively. The tax effect on the gains/(losses) on derivatives and hedges are gains of $24 million in 2007, and losses of $4 million and $11 million in 2006 and 2005, respectively. See Note 15 for additional information relating to derivatives and hedging. The currency translation adjustments are not currently adjusted for income taxes as they relate to permanent investments in international subsidiaries. Total Unrealized Gains/ Accumulated Foreign Gains/ (Losses) on Other Currency (Losses) on Employee Derivatives Comprehensive (Dollars in Millions) Translation Securities Benefit Plans & Hedges Income/(Loss) Jan. 2. 2005 $(105) 86 (346) (150) (515) 2005 changes Net change due to hedging transactions 112 Net amount reclassed to net earnings 53 Net 2005 changes (415) (16) 26 165 (240) Jan. 1.2006 $(520) 70 (320) 15 (755) 2006 changes Net change due to hedging transactions 17 Net amount reclassed to net earnings (23) Net 2006 changes 362 (9) (1,710) (6) (1,363) $(158) Dec 31, 2006 61 9 (2,030) (2,118) 2007 changes Net change due to hedging transactions (78) Net amount reclassed to net earnings 24 Net 2007 changes 786 23 670 (54) 1,425 Dec. 30, 2007 $ 628 84 (1,360) (45) (693) 13. Pensions and Other Benefit Plans The Company sponsors various retirement and pension plans, including defined benefit, defined contribution and termination indemnity plans, which cover most employees worldwide. The Company also provides postretirement benefits, primarily health care, to all U.S. retired employees and their dependents. Many international employees are covered by government- sponsored programs and the cost to the Company is not significant Retirement plan benefits are primarily based on the employee's compensation during the last three to five years before retirement and the number of years of service. Interna- tional subsidiaries have plans under which funds are deposited with trustees, annuities are purchased under group contracts, or reserves are provided. The Company does not fund retiree health care benefits in advance and has the right to modify these plans in the future. The Company uses the date of its consolidated financial statements (December 30, 2007 and December 31, 2006, respectively) as the measurement date for all U.S. and interna- tional retirement and other benefit plans. In September 2006, Statement of Financial Accounting Standards (SFAS) No. 158, Employers' Accounting for Defined Benefit Pension and Other Postretirement Plans was issued and amends further the disclosure requirements for pensions and other postretirement benefits. This Statement was an amend- ment of FASB Statements No. 87, 88, 106 and 132(R). The incremental effect of applying FASB No. 158 was a $1.7 billion reduction in Shareholder's Equity, net of deferred taxes. Total comprehensive income for 2007 includes reclassification adjustment gains of $7 million realized from the sale of equity securities and the associated tax expense of $2 million. Total other comprehensive income for 2006 includes reclassifi- cation adjustment gains of $13 million realized from the sale of equity securities and the associated tax expense of $4 million. Total other comprehensive income for 2005 includes reclassifi- cation adjustment gains of $23 million realized from the sale of equity securities and the associated tax expense of $8 million JOHNSON & JOHNSON 2007 ANNUAL REPORT Net periodic benefit costs for the Company's defined benefit retirement plans and other benefit plans for 2007, 2006 and 2005 include the following components: Other Benefit Plans 2007 2006 $140 122 149 136 (2) (3) 2005 56 Retirement Plans 2007 2006 $ 597 552 656 570 (809) (701) 10 10 1 (1) 186 251 5 4 $ 646 685 (Dollars in Millions) Service cost Interest cost Expected return on plan assets Amortization of prior service cost Amortization of net transition asset Recognized actuarial losses Curtailments and settlements Net periodic benefit cost 2005 462 488 (579) 12 (2) 219 2 602 87 (3) (7) 190 66 74 25 $346 322 158 The net periodic benefit cost attributable to U.S. retirement plans was $379 million in 2007, $423 million in 2006 and $370 million in 2005. Amounts expected to be recognized in net periodic benefit cost in the coming year for the Company's defined benefit retirement plans and other postretirement plans: (Dollars in Millions) Amortization of net transition obligation Amortization of net actuarial losses Amortization of prior service cost $ 2 132 5 The weighted-average assumptions in the following table represent the rates used to develop the actuarial present value of projected benefit obligation for the year listed and also the net periodic benefit cost for the following year. Retirement Plans 2006 Other Benefit Plans 2007 2006 2007 2005 2005 6.50% 6.00 5.75 6.50% 6.00 5.75 9.00 (Dollars in Millions) U.S. Benefit Plans Discount rate Expected long-term rate of return on plan assets Rate of increase in compensation levels International Benefit Plans Discount rate Expected long-term rate of return on plan assets Rate of increase in compensation levels 9.00 4.50 9.00 4.50 9.00 4.50 9.00 4.50 4.50 9.00 4.50 5.50% 5.00 4.75 6.50% 6.00 5.00 8.25 4.00 8.00 3.75 8.25 3.75 4.50 4.50 4.25 The following table displays the assumed health care cost trend rates, for all individuals: The Company's discount rates are determined by considering current yield curves representing high quality, long-term fixed income instru- ments. The resulting discount rates are consistent with the duration of plan liabilities. The expected long-term rate of return on plan assets assumption is determined using a building block approach, con- sidering historical averages and real returns of each asset class. In certain countries, where historical returns are not meaningful, consideration is given to local market expectations of long-term returns. 2007 9.00% 2006 9.00 Health Care Plans Health care cost trend rate assumed for next year Rate to which the cost trend rate is assumed to decline (ultimate trend) Year the rate reaches the ultimate trend rate 5.00% 2014 4.50 2012 A one-percentage-point change in assumed health care cost trend rates would have the following effect: One-Percentage Point Increase One-Percentage- Point Decrease (Dollars in Millions) Health Care Plans Total interest and service cost Postretirement benefit obligation $ 35 320 $ (27) (259) HOTES TO CONSOLIDATED FINANCIAL STATEMENTS -219- The following table sets forth information related to the benefit obligation and the fair value of plan assets at year-end 2007 and 2006 for the Company's defined benefit retirement plans and other postretirement plans: Retirement Plans 2007 2006 Other Benefit Plans 2007 2006 2,325 122 136 11 $11,660 597 656 62 14 (876) 79 (46) (481) 337 $12,002 10,171 $ 2,668 552 140 570 149 47 7 (99) (1) 443 8 (7) (402) (255) 378 12 11,660 $ 2,721 130 101 (147) 1 2,668 966 34 2 141 259 (Dollars in Millions) Change in Benefit Obligation Projected benefit obligation - beginning of year Service cost Interest cost Plan participant contributions Amendments Actuarial (gains) losses Divestitures & acquisitions Curtailments & settlements Benefits paid from plan Effect of exchange rates Projected benefit obligation -- end of year Change in Plan Assets Plan assets at fair value - beginning of year Actual return on plan assets Company contributions Plan participant contributions Settlements Divestitures & acquisitions Benefits paid from plan assets Effect of exchange rates Plan assets at fair value -- end of year Funded status at -- end of year Amounts Recognized in the Company's Balance Sheet consist of the following: Non-current assets Current liabilities Non-current liabilities Total recognized in the consolidated balance sheet -- end of year Amounts Recognized in Accumulated Other Comprehensive Income consist of the following: Net actuarial loss (gain) Prior service cost (credit) Unrecognized net transition asset Total before tax effects Accumulated Benefit Obligations - end of year Changes in Plan Assets and Benefit Obligations Recognized in Other Comprehensive Income Net periodic benefit cost Net actuarial loss (gain) Amortization of net actuarial loss Prior service cost Amortization of prior service cost Effect of exchange rates Total recognized in other comprehensive income, before tax Total recognized in net periodic benefit cost and other comprehensive income $9,538 743 317 62 (38) 55 (481) 273 $10,469 $ (1,533) 8,108 30 4 250 47 (7) 300 (402) (255) 267 9,538 $ 29 (2,122) $(2,692) (147) 30 (2,638) $ 481 (43) (1,971) $ (1,533) (2,355) 259 (26) (262) (2,430) (2,122) $(2,692) (81) (2,557) (2,638) 1,046 (42) $ 1,027 51 7 $ 1,085 $10,282 1,996 $ 1,013 44 (36) 7 2,047 $ 977 9,804 1,004 $ 646 (555) (435) (9) 14 23 $ (962) $ (316) $ 346 11 (13) (34) 6 3 $ (27) $ 319 Plans with accumulated benefit obligations in excess of plan assets consist of the following: (Dollars in Millions) Accumulated benefit obligation Projected benefit obligation Plan assets at fair value Retirement Plans 2007 2006 $(4,914) (3,085) (5,233) (3,561) 3,735 1,650 220- allocations are consistent with these types of plans. Emphasis is Strategic asset allocations are determined by country, based on the nature of the liabilities and considering the demographic placed on diversifying equities on a broad basis combined with composition of the plan participants (average age, years of ser- currency matching of the fixed income assets. vice and active versus retiree status). The Company's plans are considered non-mature plans and the long-term strategic asset The following table displays the projected future benefit payments from the Company's retirement and other benefit plans: 2008 2010 2009 2011 2012 (Dollars in Millions) 2013-2017 Projected future benefit payments Retirement plans $457 472 507 542 564 3,467 Other benefit plans-gross $274 180 184 188 192 1,080 Medicare rebates (9) (11) (12) (13) (14) (94) Other benefit plans-net $265 $169 $172 $175 $178 $986 The Company was not required to fund its U.S. retirement plans appropriate to meet the long-term obligations of the plans. In in 2007 and is not required, nor does it anticipate funding in certain countries other than the United States, the funding of 2008 to meet minimum statutory funding requirements. Inter- pension plans is not a common practice as funding provides no national plans are funded in accordance with local regulations. economic benefit. Consequently the Company has several pen- Additional discretionary contributions are made when deemed sion plans which are not funded. The following table displays the projected future minimum contributions to the Company's U.S. and international unfunded retirement plans. These amounts do not include any discretionary contributions that the Company may elect to make in the future. (Dollars in Millions) 2008 2009 2010 2011 2012 2013-2017 Projected future contributions Unfunded U.S. retirement plans $28 30 33 35 38 238 Unfunded International retirement plans $23 25 28 29 31 178 The Company's retirement plan asset allocation at the end of 2007 and 2006 and target allocations for 2008 are as follows: Percent of Plan Assets 2007 Target Allocation 2008 2006 79% 21 100% 78% 22 100% 75% 25 100% U.S. Retirement Plans Equity securities Debt securities Total plan assets International Retirement Plans Equity securities Debt securities Real estate and other Total plan assets 67% 32 67% 33 67% 32 1 100% 100% 100% The Company's other benefit plans are unfunded except for U.S. life insurance contract assets of $29 million and $30 million at December 30, 2007 and December 31, 2006, respectively. The fair value of Johnson & Johnson common stock directly held in plan assets was $462 million (4.4% of total plan assets) at December 30, 2007 and $452 million (4.9% of total plan assets) at December 31, 2006. NOTES TO CONSOLAT