

Answered step by step
Verified Expert Solution
Question
1 Approved Answer
Product filling weights are normally distributed with a mean of 335 grams and a standard deviation of 13 grams. a. Compute the x chart upper
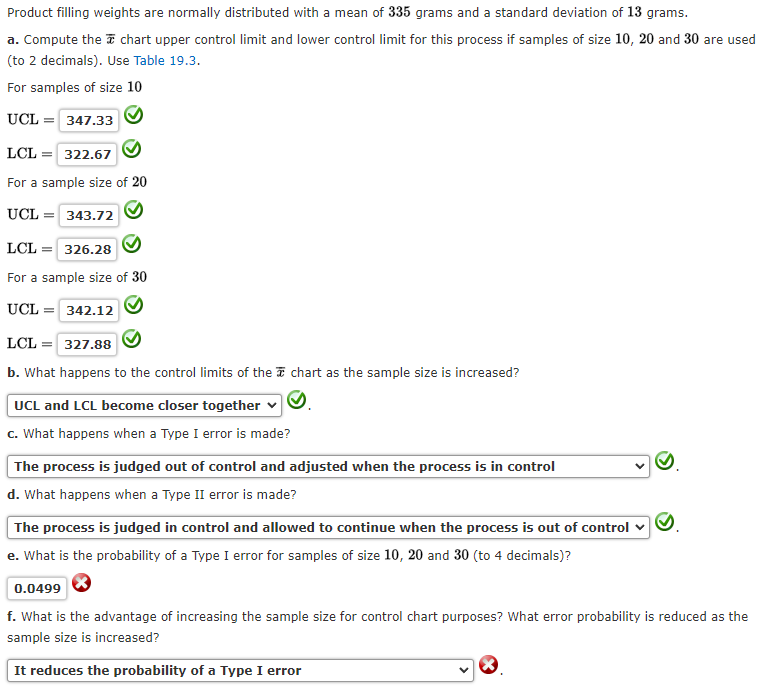 Product filling weights are normally distributed with a mean of 335 grams and a standard deviation of 13 grams. a. Compute the x chart upper control limit and lower control limit for this process if samples of size 10 , 20 and 30 are used (to 2 decimals). Use Table 19.3. For samples of size 10 UCL= LCL= For a sample size of 20 UCL= LCL= For a sample size of 30 UCL= LCL= b. What happens to the control limits of the x chart as the sample size is increased? c. What happens when a Type I error is made? The process is judged out of control and adjusted when the process is in control d. What happens when a Type II error is made? The process is judged in control and allowed to continue when the process is out of control e. What is the probability of a Type I error for samples of size 10,20 and 30 (to 4 decimals)? f. What is the advantage of increasing the sample size for control chart purposes? What error probability is reduced as the sample size is increased
 Step by Step Solution
There are 3 Steps involved in it
Step: 1

Get Instant Access to Expert-Tailored Solutions
See step-by-step solutions with expert insights and AI powered tools for academic success
Step: 2

Step: 3
Ace Your Homework with AI
Get the answers you need in no time with our AI-driven, step-by-step assistance
Get Started
Understanding And Auditing IT Systems Volume 1
Authors: Young-Woon Min
2nd Edition
978-1257124084