Answered step by step
Verified Expert Solution
Question
1 Approved Answer
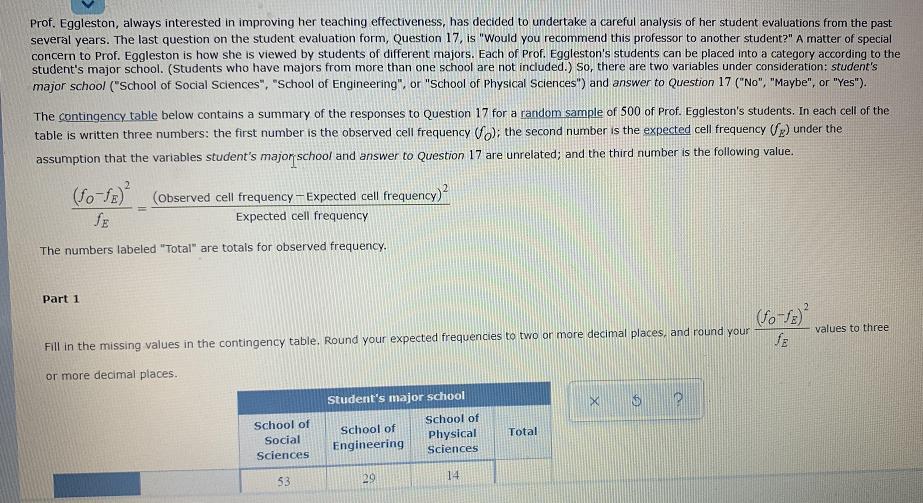
Prof. Eggleston, always interested in improving her teaching effectiveness, has decided to undertake a careful analysis of her student evaluations from the past several


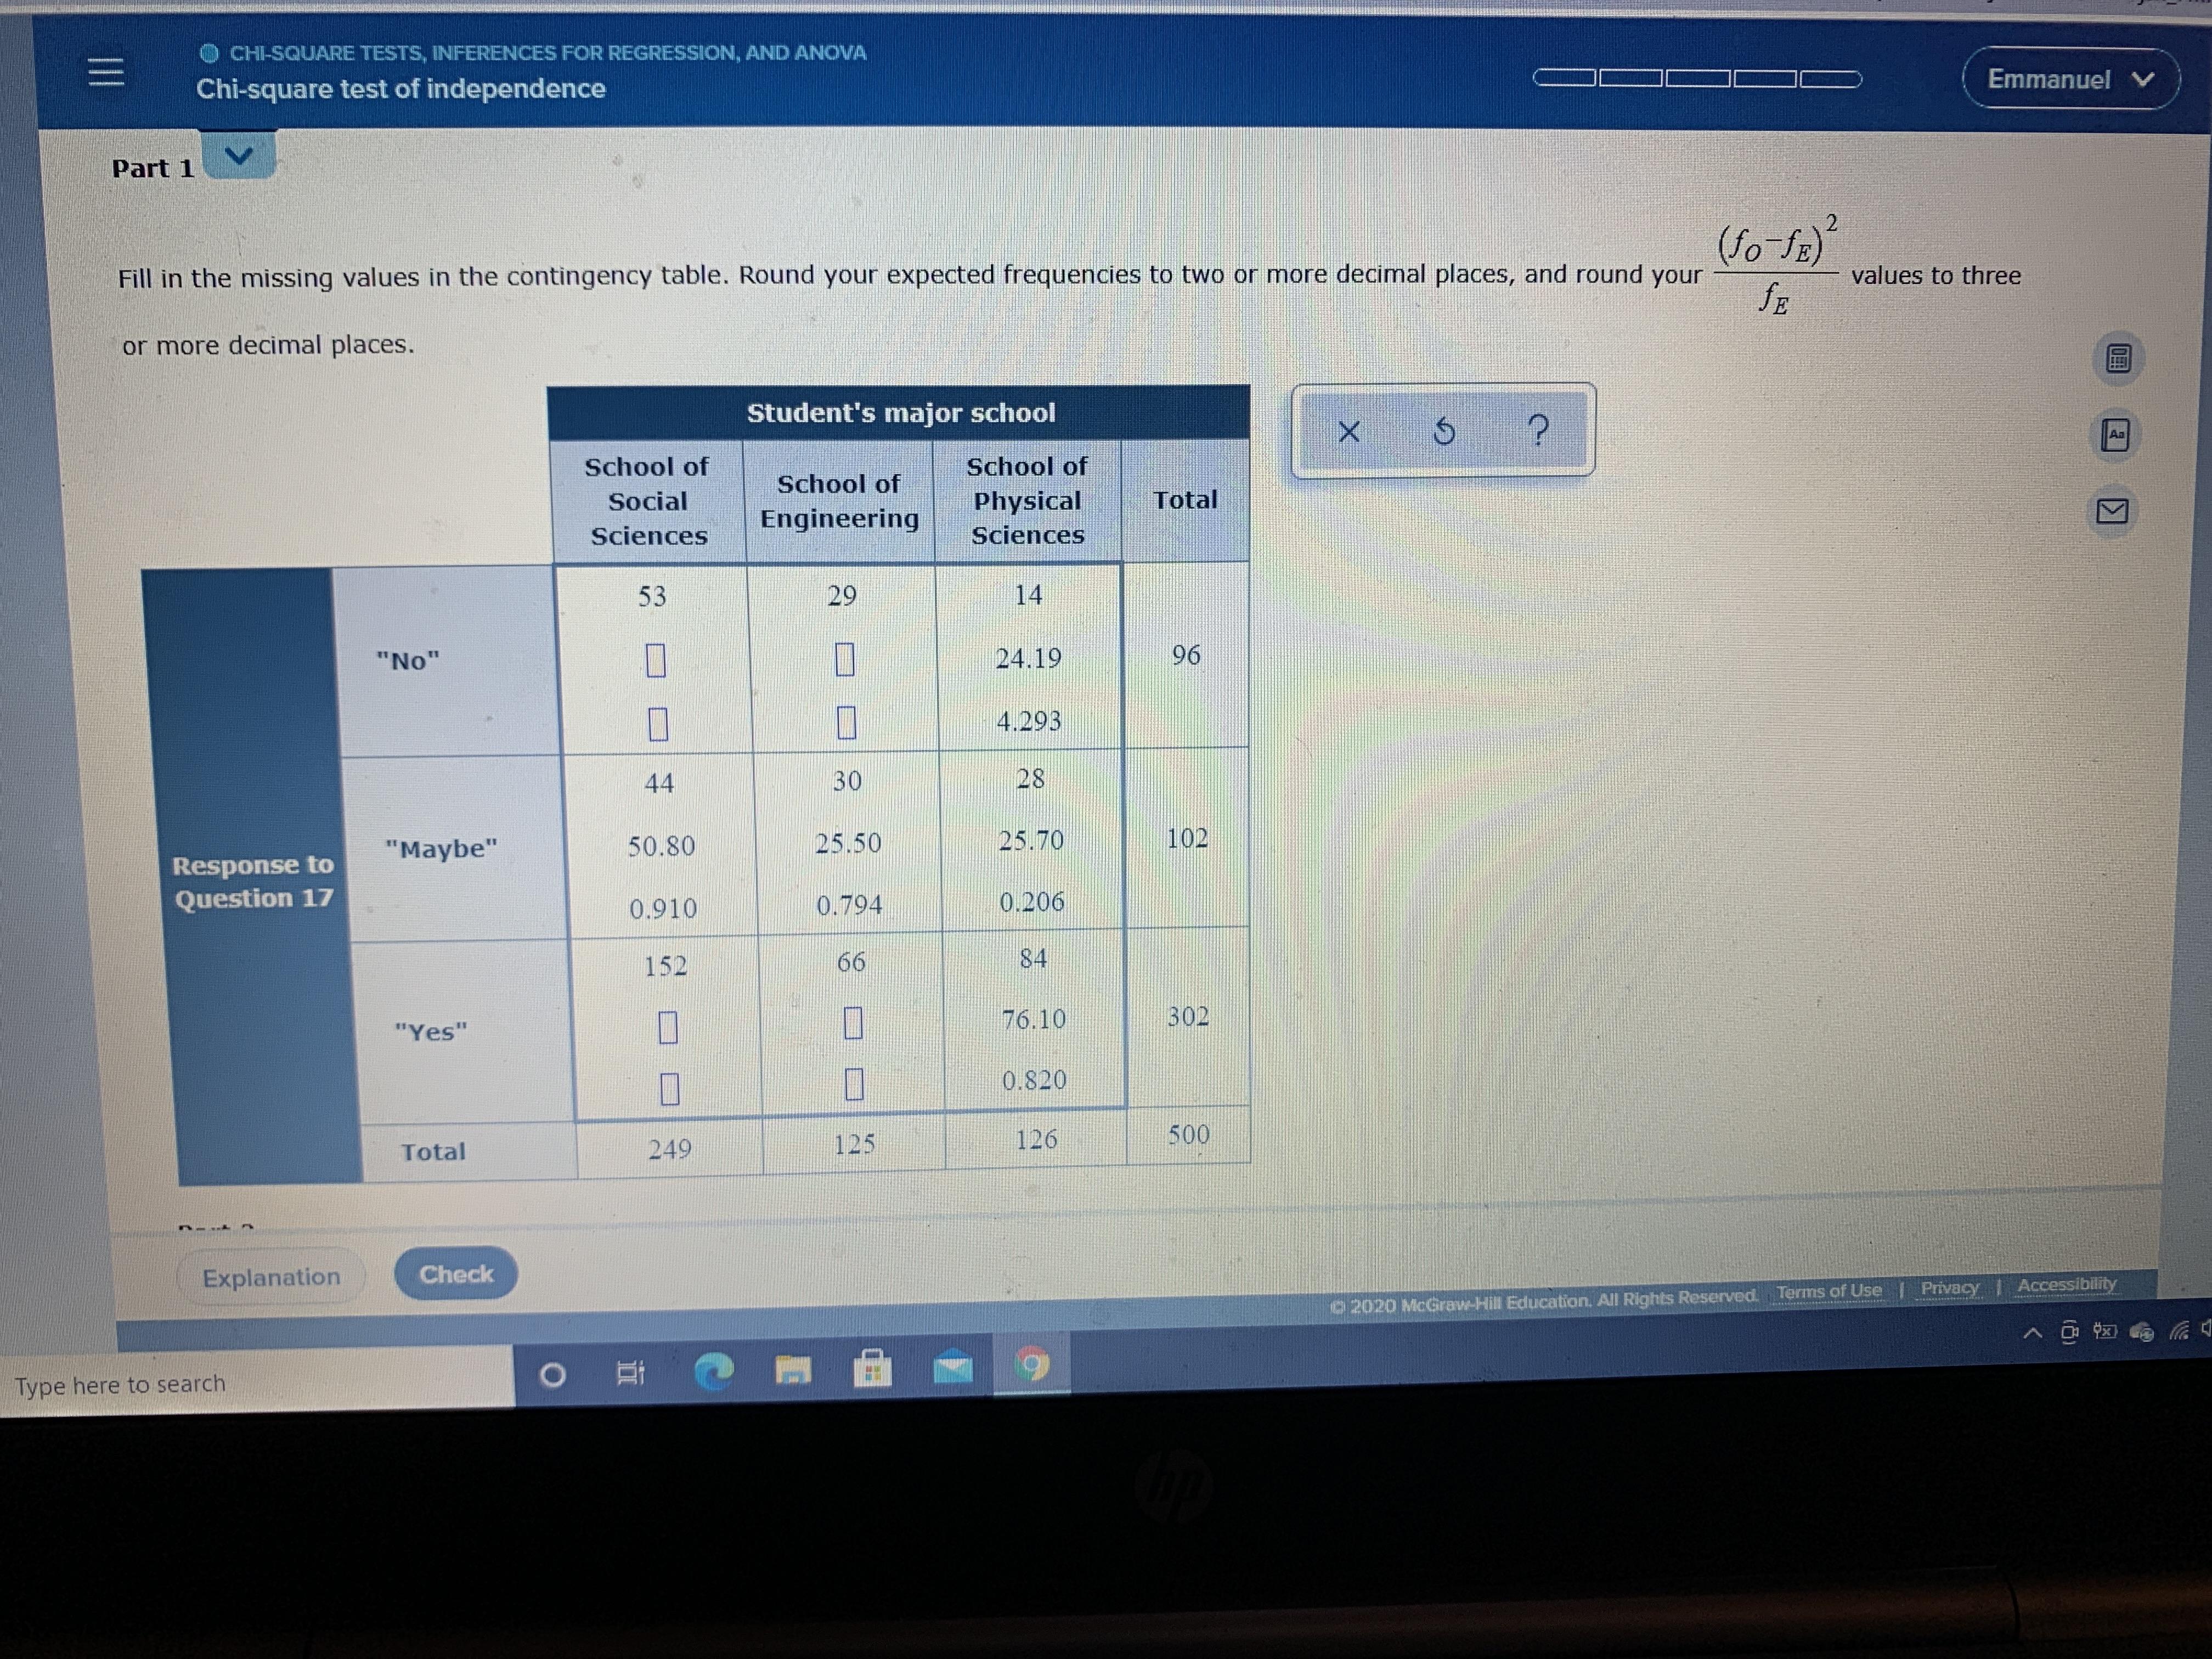
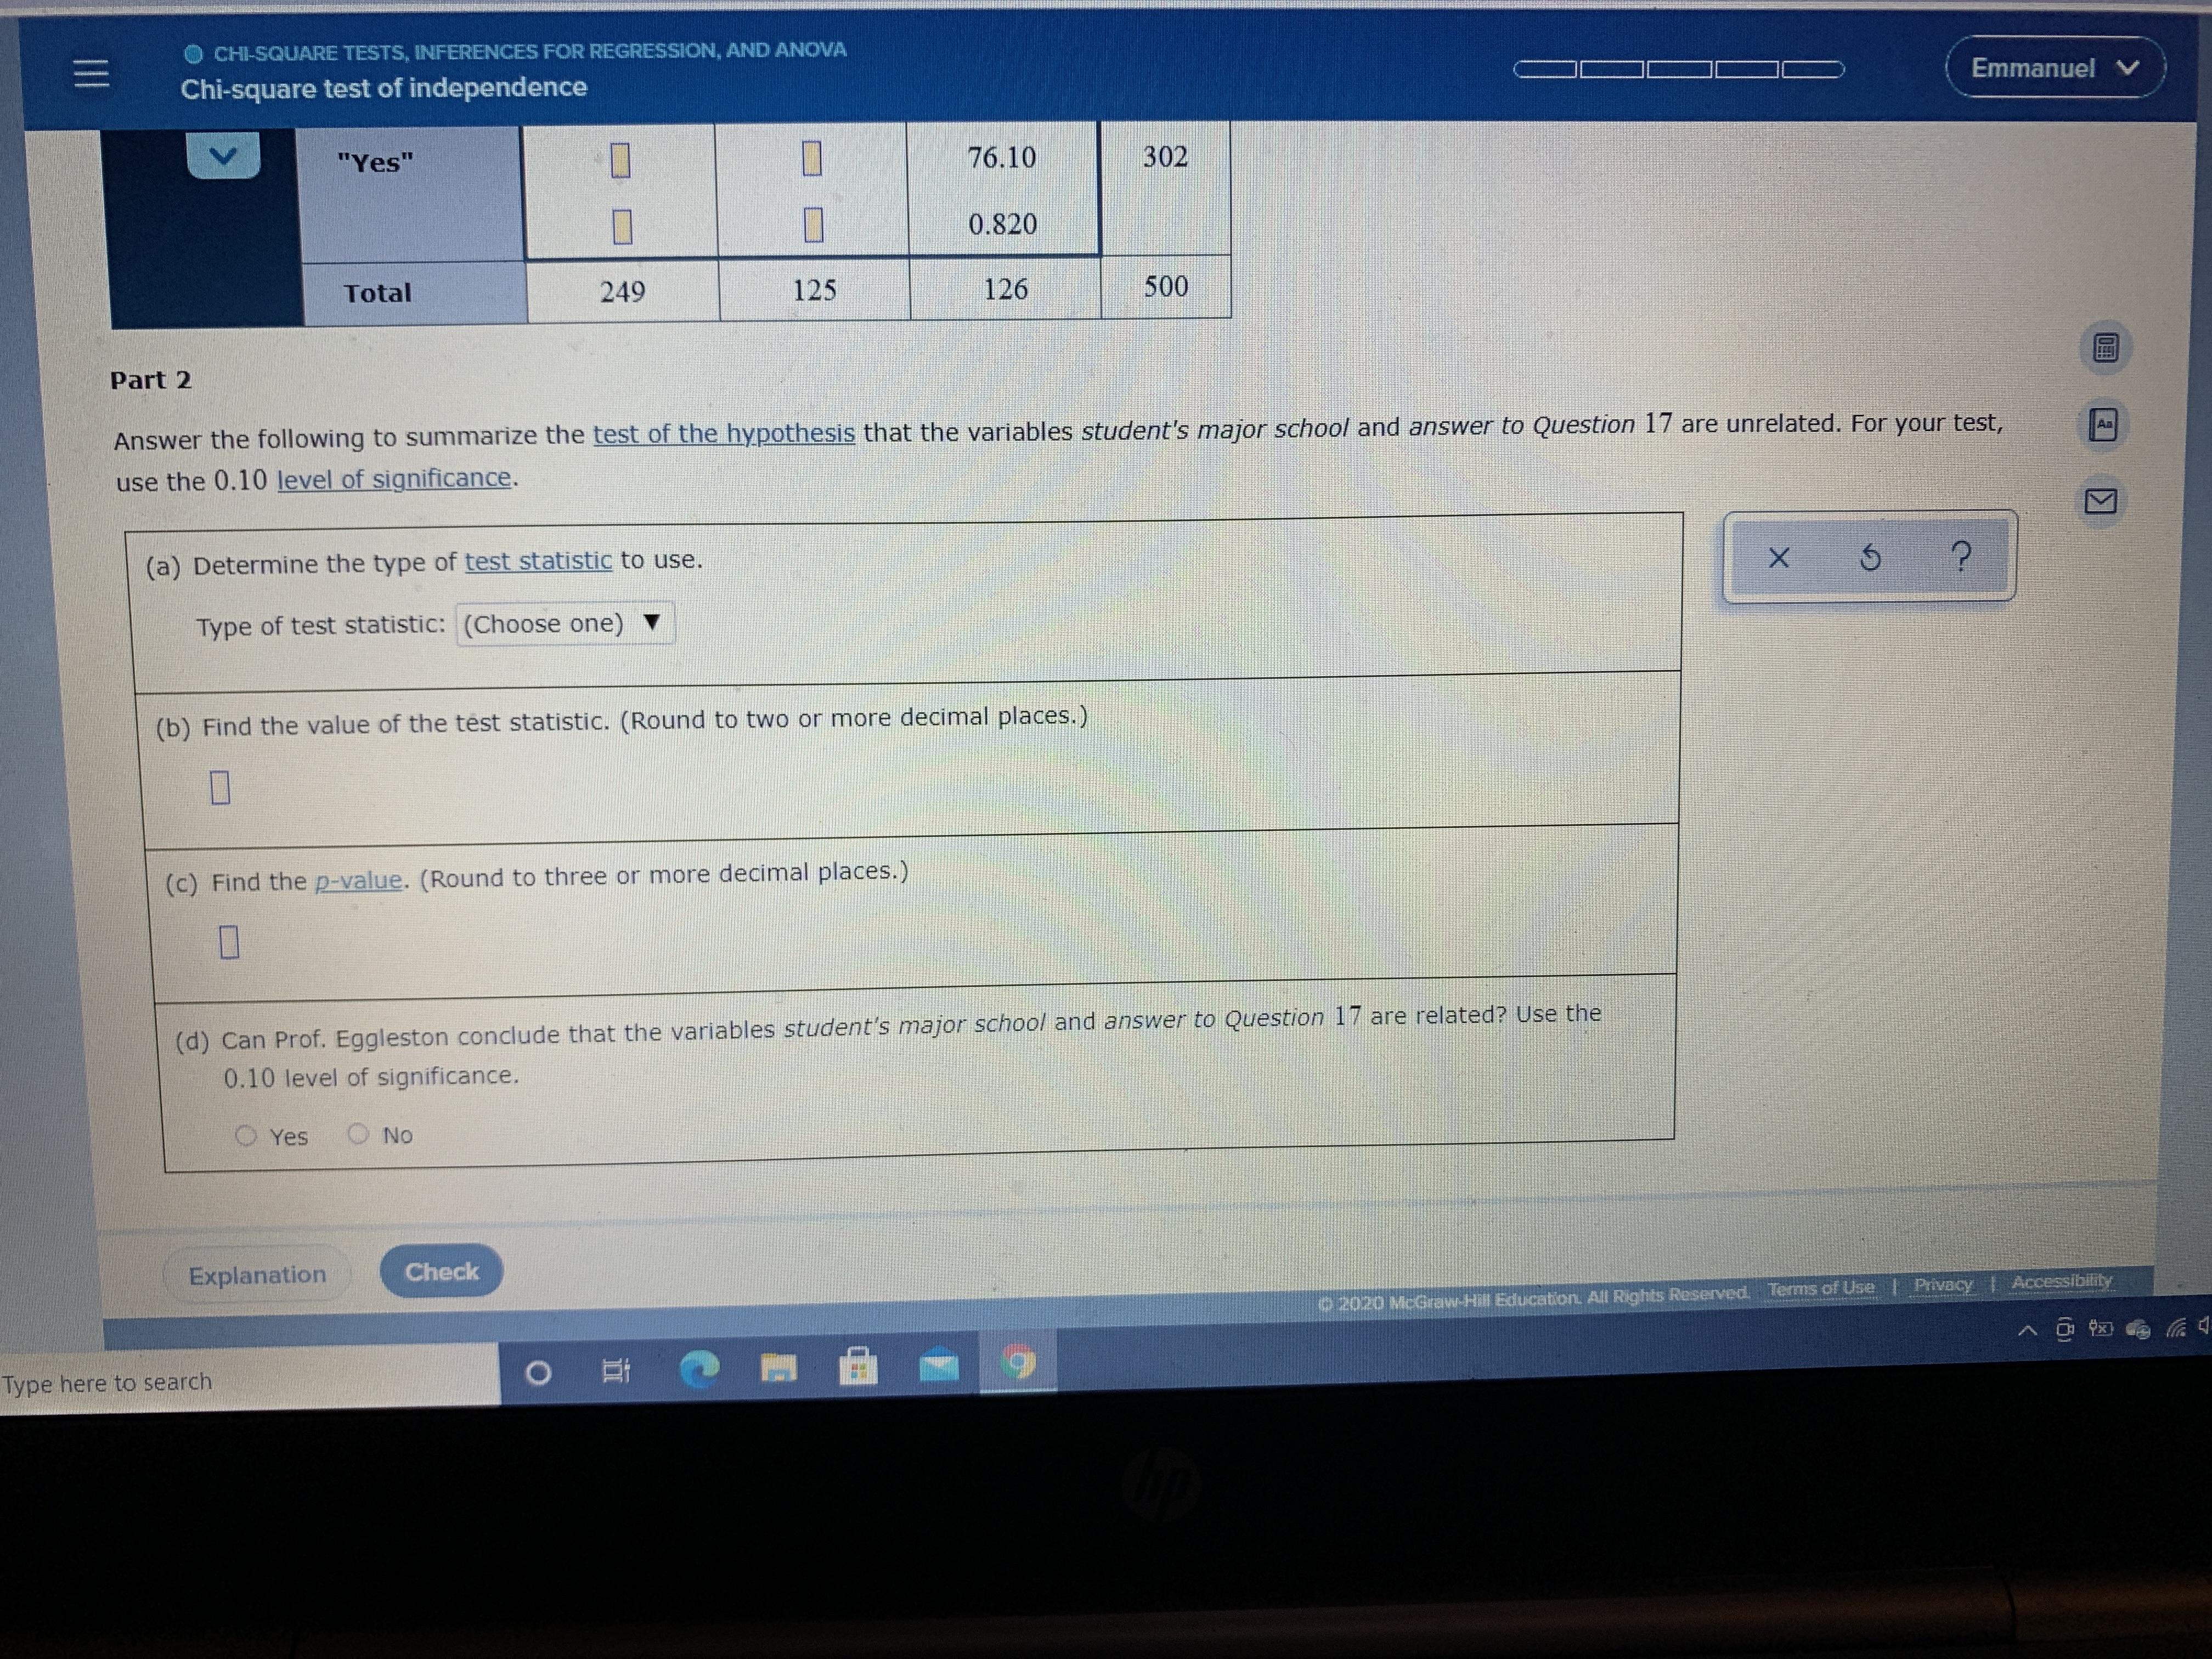
Prof. Eggleston, always interested in improving her teaching effectiveness, has decided to undertake a careful analysis of her student evaluations from the past several years. The last question on the student evaluation form, Question 17, is "Would you recommend this professor to another student?" A matter of special concern to Prof. Eggleston is how she is viewed by students of different majors. Each of Prof. Eggleston's students can be placed into a category according to the student's major school. (Students who have majors from more than one school are not included.) So, there are two variables under consideration; student's major school ("School of Social Sciences", "School of Engineering", or "School of Physical Sciences") and answer to Question 17 ("No", "Maybe", or "Yes"). The contingency table below contains a summary of the responses to Question 17 for a random sample of 500 of Prof. Eggleston's students. In each cell of the table is written three numbers: the first number is the observed cell frequency (So); the second number is the expected cell frequency Sr) under the assumption that the variables student's major school and answer to Question 17 are unrelated; and the third number is the following value. (fo-Se) (Observed cell frequency -Expected cell frequency) Expected cell frequency The numbers labeled "Total" are totals for observed frequency. Part 1 Fill in the missing values in the contingency table. Round your expected frequencies to two or more decimal places, and round your values to three fe or more decimal places. Student's major school School of School of School of Physical Total Social Sciences Engineering Sciences 53 29 14 O CHI-SQUARE TESTS, INFERENCES FOR REGRESSION, AND ANOVA Emmanuel V Chi-square test of independence Part 1 2 JE Fill in the missing values in the contingency table. Round your expected frequencies to two or more decimal places, and round your values to three or more decimal places. Student's major school School of School of School of Social Physical Total Engineering Sciences Sciences 53 29 14 "No" 24.19 96 4.293 44 30 28 "Maybe" 50.80 25.50 25.70 102 Response to Question 17 0.910 0.794 0.206 152 66 84 76.10 302 "Yes" 0.820 249 125 126 500 Total Explanation Check 2020 McGraw-Hill Education. All Rights Reserved Terms of Use Privacy Accessibility Type here to search 0 II O CHI-SQUARE TESTS, INFERENCES FOR REGRESSION, AND ANOVA Emmanuel V Chi-square test of independence "Yes" 76.10 302 0.820 Total 249 125 126 500 Part 2 Aa Answer the following to summarize the test of the hypothesis that the variables student's major school and answer to Question 17 are unrelated. For your test, use the 0.10 level of significance. (a) Determine the type of test statistic to use. Type of test statistic: (Choose one) (b) Find the value of the tst statistic. (Round to two or more decimal places.) (c) Find the p-value. (Round to three or more decimal places.) (d) Can Prof. Eggleston conclude that the variables student's major school and answer to Question 17 are related? Use the 0.10 level of significance. O Yes O No Explanation Check Privacy Accessibility 2020 McGraw-Hill Education. All Rights Reserved, Terms of Use Type here to search II
Step by Step Solution
★★★★★
3.45 Rating (174 Votes )
There are 3 Steps involved in it
Step: 1

Get Instant Access to Expert-Tailored Solutions
See step-by-step solutions with expert insights and AI powered tools for academic success
Step: 2

Step: 3

Ace Your Homework with AI
Get the answers you need in no time with our AI-driven, step-by-step assistance
Get Started


