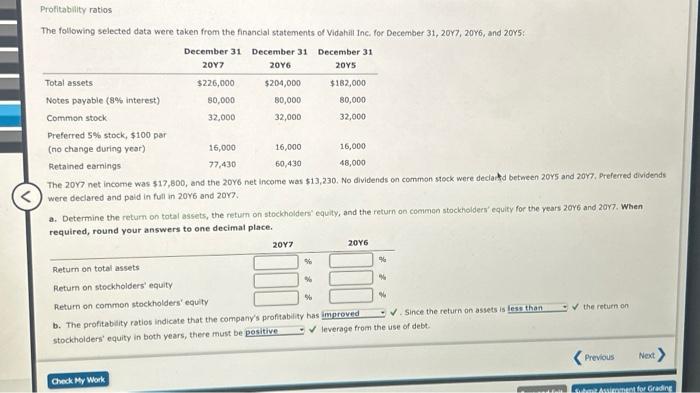
Profitability ratios The following selected data were taken from the financial statements of Vidahill Inc. for December 31, 2017, 2016, and 2015: December 31


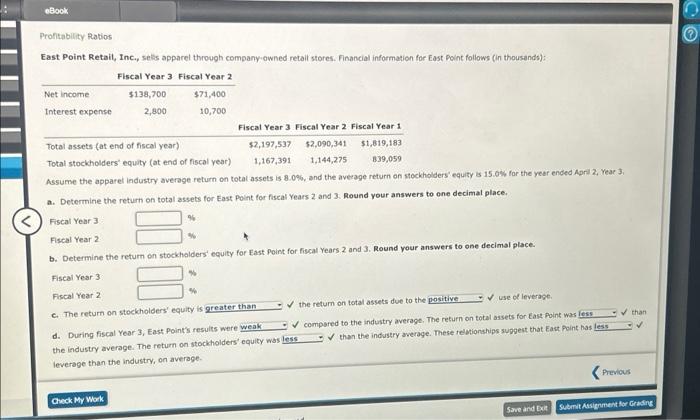
Profitability ratios The following selected data were taken from the financial statements of Vidahill Inc. for December 31, 2017, 2016, and 2015: December 31 December 31 December 31. 2017 2016 2015 Total assets $226,000 $204,000 $182,000 Notes payable (8% interest) 80,000 80,000 80,000 Common stock 32,000 32,000 32,000 Preferred 5% stock, $100 par (no change during year) 16,000 16,000 16,000 Retained earnings 77,430 60,430 48,000 The 2017 net income was $17,800, and the 2016 net income was $13,230. No dividends on common stock were declared between 2015 and 2017. Preferred dividends were declared and paid in full in 2016 and 2017. a. Determine the return on total assets, the return on stockholders' equity, and the return on common stockholders' equity for the years 2016 and 2017. When required, round your answers to one decimal place. 2017 2016 Return on total assets % % Return on stockholders' equity % % Return on common stockholders' equity % 94 b. The profitability ratios indicate that the company's profitability has improved stockholders' equity in both years, there must be positive Since the return on assets is less than the return on leverage from the use of debt. Previous Next > Check My Work Submit Assignment for Grading eBook Profitability Ratios East Point Retail, Inc., sells apparel through company-owned retail stores. Financial information for East Point follows (in thousands): Fiscal Year 3 Fiscal Year 2 $71,400 Net income $138,700 Interest expense 2,800 10,700 Total assets (at end of fiscal year) Total stockholders' equity (at end of fiscal year) Fiscal Year 3 Fiscal Year 2 Fiscal Year 1 $2,197,537 1,167,391 $2,090,341 1,144,275 $1,819,183 839,059 Assume the apparel industry average return on total assets is 8.0%, and the average return on stockholders' equity is 15.0% for the year ended April 2, Year 3. a. Determine the return on total assets for East Point for fiscal Years 2 and 3. Round your answers to one decimal place. Fiscal Year 3 Fiscal Year 2 b. Determine the return on stockholders' equity for East Point for fiscal Years 2 and 3. Round your answers to one decimal place. Fiscal Year 3 Fiscal Year 2 % c. The return on stockholders' equity is greater than d. During fiscal Year 3, East Point's results were weak the industry average. The return on stockholders' equity was less leverage than the industry, on average. the return on total assets due to the positive use of leverage. compared to the industry average. The return on total assets for East Point was fess than the industry average. These relationships suggest that East Point has less Check My Work than Previous CO Save and Exit Submit Assignment for Grading i
Step by Step Solution
There are 3 Steps involved in it
Step: 1
Certainly lets analyze the image you sent to calculate the profitability ratios for Vidahill Inc a Determine the return on total assets the return on stockholders equity and the return on common stock...
See step-by-step solutions with expert insights and AI powered tools for academic success
Step: 2

Step: 3

Ace Your Homework with AI
Get the answers you need in no time with our AI-driven, step-by-step assistance
Get Started


