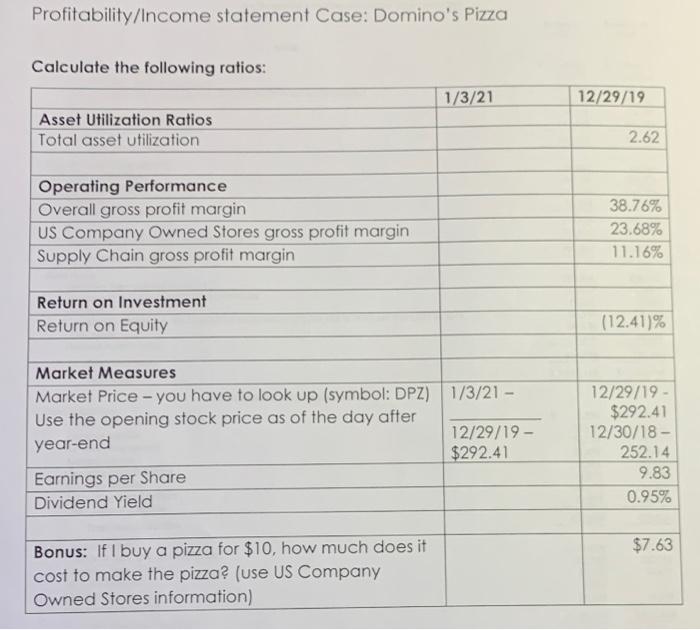
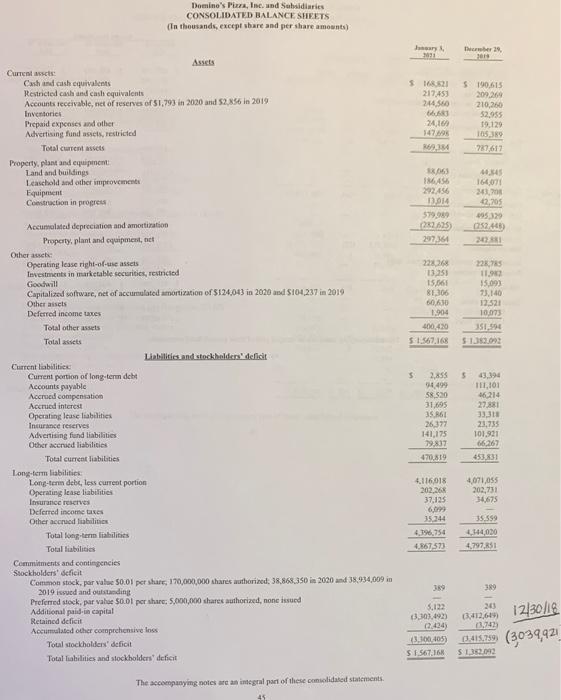
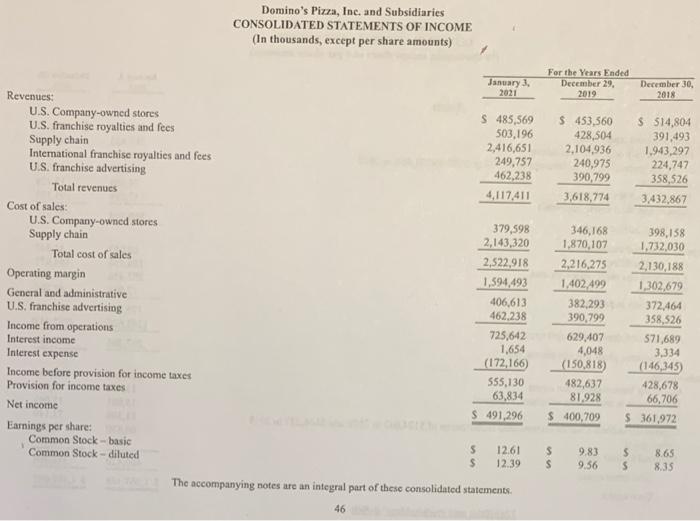
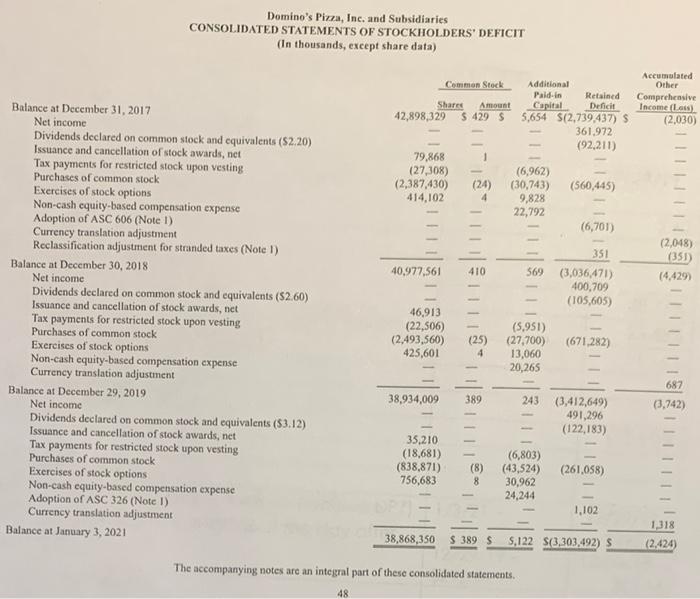
Profitability/Income statement Case: Domino's Pizza Calculate the following ratios: 1/3/21 12/29/19 Asset Utilization Ratios Total asset utilization 2.62 Operating Performance Overall gross profit margin US Company Owned Stores gross profit margin Supply Chain gross profit margin 38.76% 23.68% 11.16% Return on Investment Return on Equity (12.41) Market Measures Market Price - you have to look up (symbol: DPZ) 1/3/21 - Use the opening stock price as of the day after year-end 12/29/19 - $292.41 Earnings per Share Dividend Yield 12/29/19 - $292.41 12/30/18 - 252.14 9.83 0.95% $7.63 Bonus: Ifl buy a pizza for $10, how much does it cost to make the pizza? (use US Company Owned Stores information) Domino's Pizza, Inc. and Subsidiaries CONSOLIDATED BALANCE SHEETS (In thousands, except share and pershare amounts) January 2021 Ther29 $168.21 217.453 244,566 Assets Current Cash and cash equivalents Restricted cash and cash equivalents Accounts receivable, net of reserves of 51,793 in 2020 and 52,56 in 2019 Inventories Prepaid expenses and other Advertising fundussels, restricted Total current assets Property, plant and equipment Land and buildings Leasehold and other improvement Equipment Construction in progress $190.615 209.264 210,260 52,955 19.129 1053 24.169 147 186456 12014 579,00 282625 29736 1640 243,708 42,205 195329 52.445 2013 2226 3351 15,061 81306 50.60 1.904 400.420 51.567,168 22,745 11,90 15.093 13,140 12.521 10073 JS1,594 S302 5 Accumulated depreciation and amortization Property, plant and equipment, net Others Operating lease right-of-use assets Investments in marketable securities, restricted Goodwill Capitalized software, net of accumulated amortization of $124.043 in 2020 and $104.237 in 2019 Other assets Deferred income taxes Total other assets Total assets Liabilities and stockholdersdelict Current liabilities Current portion of long-term dicht Accounts payable Accrued compensation Accrued interest Operating lease liabilities Insurance reserves Advertising fund liabilities Other accred liabilities Total current liabilities Long-term liabilities Long-term deb, less current portion Operating lease liabilities Insurance reserves Deferred income tres Other accrued liabilities Total long-term liabilities Total abilities Commitments and contingencies Stockholders' Gcficit Common stock, par value 50.01 per share, 170,000,000 shares authorized: 38,863.350 in 2020 and 38.934,009 in 2019 issued and outstanding Preferred stock, par value $0.0 per share: 5,000,000 sharest authorized, none issued Additional paid-in capital Retained deficit Accumulated other comprehensive los Total stockholders' deficit Total liabilities and stockholders' deficit 2.855 04499 58.530 31,695 35.261 26,377 141,175 79.837 470,819 543,394 111,101 46.214 27.881 33,311 23.735 101.921 66.267 453,831 *.116018 202.266 37.125 4,071,055 202,751 34675 35.344 4,196,754 4.867573 35.399 4.544,020 4.797,R$1 389 5,122 13.303.492) 2.434) 3.100.405) 12/30/18 11.415.789 (3039,421 30 3,412,61 14 S.567,16 S30093 The accompanying notes are an integral part of these consolidated statements 45 Domino's Pizza, Inc. and Subsidiaries CONSOLIDATED STATEMENTS OF INCOME (In thousands, except per share amounts) January 3, For the Years Ended December 29, 2019 2021 December 30, 2018 S485,569 503.196 2,416,651 249,757 462,238 4,117,411 $ 453,560 428,504 2,104936 240,975 390,799 3,618,774 $ $14,804 391,493 1,943,297 224,747 358, 526 3,432,867 Revenues: U.S. Company-owned stores U.S. franchise royalties and fees Supply chain International franchise royalties and fees U.S. franchise advertising Total revenues Cost of sales: U.S. Company-owned stores Supply chain Total cost of sales Operating margin General and administrative U.S. franchise advertising Income from operations Interest income Interest expense Income before provision for income taxes Provision for income taxes Net income Earnings per share: Common Stock-basic Common Stock-diluted 379,598 2,143,320 2,522,918 1,594,493 406,613 462.238 725,642 1,654 (172,166 555,130 63,834 $ 491,296 346,168 1,870,107 2,216,275 1.402.499 382,293 390,799 629,407 4,048 (150,818) 482,637 81,928 $ 400,709 398,158 1,732,030 2.130,188 1,302,679 372,464 358,526 571,689 3,334 (146,345 428,678 66,706 S 361.972 s $ 12.61 12.39 $ $ 9.83 9.56 $ $ 8.65 8.35 The accompanying notes are an integral part of these consolidated statements. 46 Domino's Pizza, Inc. and Subsidiaries CONSOLIDATED STATEMENTS OF STOCKHOLDERS' DEFICIT (In thousands, except share data) Common Stock Share Amount 42,898,329 $ 429 $ Additional Paid in Retained Capital Deficit 5,654 S(2,739,437) S 361.972 (92,211) Accumulated Other Comprehensive Income Les) (2,030) 79,868 (27,308) (2,387,430) 414,102 (24) 4 (6,962) (30,743) 9,828 22,792 (560,445) (6,701) 351 (2,048) (351) (4.429) 40,977,561 410 569 LI (3,036,471) 400,709 (105,605) Balance at December 31, 2017 Net income Dividends declared on common stock and equivalents (52.20) Issuance and cancellation of stock awards, net Tax payments for restricted stock upon vesting Purchases of common stock Exercises of stock options Non-cash equity-based compensation expense Adoption of ASC 606 (Note 1) Currency translation adjustment Reclassification adjustment for stranded taxes (Note 1) Balance at December 30, 2018 Net income Dividends declared on common stock and equivalents (52.60) Issuance and cancellation of stock awards, net Tax payments for restricted stock upon vesting Purchases of common stock Exercises of stock options Non-cash equity-based compensation expense Currency translation adjustment Balance at December 29, 2019 Net income Dividends declared on common stock and equivalents (53.12) Issuance and cancellation of stock awards, net Tax payments for restricted stock upon vesting Purchases of common stock Exercises of stock options Non-cash equity-based compensation expense Adoption of ASC 326 (Note 1) Currency translation adjustment Balance at January 3, 2021 46.913 (22,506) (2,493,560) 425,601 (25) 4 (5.951) (27,700) (671,282) 13,060 20,265 - 687 38,934,009 389 243 (3,742) (3,412,649) 491,296 (122,183) III 35,210 (18,681) (838,871) 756,683 (8) 8 (6,803) (43,524) 30,962 24.244 (261,058) 1,102 38,868,350 $ 389S 5,122 $(3,303.492) S 1,318 (2.424) The accompanying notes are an integral part of these consolidated statements. 48 Profitability/Income statement Case: Domino's Pizza Calculate the following ratios: 1/3/21 12/29/19 Asset Utilization Ratios Total asset utilization 2.62 Operating Performance Overall gross profit margin US Company Owned Stores gross profit margin Supply Chain gross profit margin 38.76% 23.68% 11.16% Return on Investment Return on Equity (12.41) Market Measures Market Price - you have to look up (symbol: DPZ) 1/3/21 - Use the opening stock price as of the day after year-end 12/29/19 - $292.41 Earnings per Share Dividend Yield 12/29/19 - $292.41 12/30/18 - 252.14 9.83 0.95% $7.63 Bonus: Ifl buy a pizza for $10, how much does it cost to make the pizza? (use US Company Owned Stores information) Domino's Pizza, Inc. and Subsidiaries CONSOLIDATED BALANCE SHEETS (In thousands, except share and pershare amounts) January 2021 Ther29 $168.21 217.453 244,566 Assets Current Cash and cash equivalents Restricted cash and cash equivalents Accounts receivable, net of reserves of 51,793 in 2020 and 52,56 in 2019 Inventories Prepaid expenses and other Advertising fundussels, restricted Total current assets Property, plant and equipment Land and buildings Leasehold and other improvement Equipment Construction in progress $190.615 209.264 210,260 52,955 19.129 1053 24.169 147 186456 12014 579,00 282625 29736 1640 243,708 42,205 195329 52.445 2013 2226 3351 15,061 81306 50.60 1.904 400.420 51.567,168 22,745 11,90 15.093 13,140 12.521 10073 JS1,594 S302 5 Accumulated depreciation and amortization Property, plant and equipment, net Others Operating lease right-of-use assets Investments in marketable securities, restricted Goodwill Capitalized software, net of accumulated amortization of $124.043 in 2020 and $104.237 in 2019 Other assets Deferred income taxes Total other assets Total assets Liabilities and stockholdersdelict Current liabilities Current portion of long-term dicht Accounts payable Accrued compensation Accrued interest Operating lease liabilities Insurance reserves Advertising fund liabilities Other accred liabilities Total current liabilities Long-term liabilities Long-term deb, less current portion Operating lease liabilities Insurance reserves Deferred income tres Other accrued liabilities Total long-term liabilities Total abilities Commitments and contingencies Stockholders' Gcficit Common stock, par value 50.01 per share, 170,000,000 shares authorized: 38,863.350 in 2020 and 38.934,009 in 2019 issued and outstanding Preferred stock, par value $0.0 per share: 5,000,000 sharest authorized, none issued Additional paid-in capital Retained deficit Accumulated other comprehensive los Total stockholders' deficit Total liabilities and stockholders' deficit 2.855 04499 58.530 31,695 35.261 26,377 141,175 79.837 470,819 543,394 111,101 46.214 27.881 33,311 23.735 101.921 66.267 453,831 *.116018 202.266 37.125 4,071,055 202,751 34675 35.344 4,196,754 4.867573 35.399 4.544,020 4.797,R$1 389 5,122 13.303.492) 2.434) 3.100.405) 12/30/18 11.415.789 (3039,421 30 3,412,61 14 S.567,16 S30093 The accompanying notes are an integral part of these consolidated statements 45 Domino's Pizza, Inc. and Subsidiaries CONSOLIDATED STATEMENTS OF INCOME (In thousands, except per share amounts) January 3, For the Years Ended December 29, 2019 2021 December 30, 2018 S485,569 503.196 2,416,651 249,757 462,238 4,117,411 $ 453,560 428,504 2,104936 240,975 390,799 3,618,774 $ $14,804 391,493 1,943,297 224,747 358, 526 3,432,867 Revenues: U.S. Company-owned stores U.S. franchise royalties and fees Supply chain International franchise royalties and fees U.S. franchise advertising Total revenues Cost of sales: U.S. Company-owned stores Supply chain Total cost of sales Operating margin General and administrative U.S. franchise advertising Income from operations Interest income Interest expense Income before provision for income taxes Provision for income taxes Net income Earnings per share: Common Stock-basic Common Stock-diluted 379,598 2,143,320 2,522,918 1,594,493 406,613 462.238 725,642 1,654 (172,166 555,130 63,834 $ 491,296 346,168 1,870,107 2,216,275 1.402.499 382,293 390,799 629,407 4,048 (150,818) 482,637 81,928 $ 400,709 398,158 1,732,030 2.130,188 1,302,679 372,464 358,526 571,689 3,334 (146,345 428,678 66,706 S 361.972 s $ 12.61 12.39 $ $ 9.83 9.56 $ $ 8.65 8.35 The accompanying notes are an integral part of these consolidated statements. 46 Domino's Pizza, Inc. and Subsidiaries CONSOLIDATED STATEMENTS OF STOCKHOLDERS' DEFICIT (In thousands, except share data) Common Stock Share Amount 42,898,329 $ 429 $ Additional Paid in Retained Capital Deficit 5,654 S(2,739,437) S 361.972 (92,211) Accumulated Other Comprehensive Income Les) (2,030) 79,868 (27,308) (2,387,430) 414,102 (24) 4 (6,962) (30,743) 9,828 22,792 (560,445) (6,701) 351 (2,048) (351) (4.429) 40,977,561 410 569 LI (3,036,471) 400,709 (105,605) Balance at December 31, 2017 Net income Dividends declared on common stock and equivalents (52.20) Issuance and cancellation of stock awards, net Tax payments for restricted stock upon vesting Purchases of common stock Exercises of stock options Non-cash equity-based compensation expense Adoption of ASC 606 (Note 1) Currency translation adjustment Reclassification adjustment for stranded taxes (Note 1) Balance at December 30, 2018 Net income Dividends declared on common stock and equivalents (52.60) Issuance and cancellation of stock awards, net Tax payments for restricted stock upon vesting Purchases of common stock Exercises of stock options Non-cash equity-based compensation expense Currency translation adjustment Balance at December 29, 2019 Net income Dividends declared on common stock and equivalents (53.12) Issuance and cancellation of stock awards, net Tax payments for restricted stock upon vesting Purchases of common stock Exercises of stock options Non-cash equity-based compensation expense Adoption of ASC 326 (Note 1) Currency translation adjustment Balance at January 3, 2021 46.913 (22,506) (2,493,560) 425,601 (25) 4 (5.951) (27,700) (671,282) 13,060 20,265 - 687 38,934,009 389 243 (3,742) (3,412,649) 491,296 (122,183) III 35,210 (18,681) (838,871) 756,683 (8) 8 (6,803) (43,524) 30,962 24.244 (261,058) 1,102 38,868,350 $ 389S 5,122 $(3,303.492) S 1,318 (2.424) The accompanying notes are an integral part of these consolidated statements. 48


