Program: MATLAB

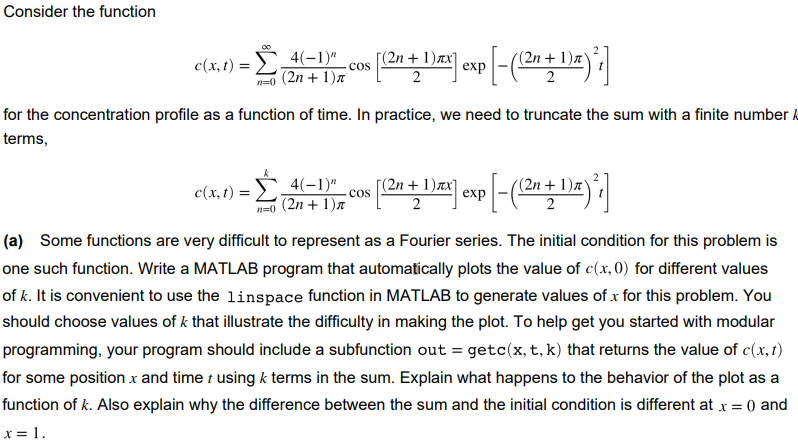
Consider the function 4(-1)" c(x, t) = COS [2, 4, 1928) exp [-(2n 1) ) ?] 1=(2n + 1) for the concentration profile as a function of time. In practice, we need to truncate the sum with a finite number terms, c(x,t) = 4(-1)" (2n + 1) COS [(21 + )Ax] exp | exp[-(2, 3 D.)?] n=0 (a) Some functions are very difficult to represent as a Fourier series. The initial condition for this problem is one such function. Write a MATLAB program that automatically plots the value of c(x,0) for different values of k. It is convenient to use the linspace function in MATLAB to generate values of x for this problem. You should choose values of k that illustrate the difficulty in making the plot. To help get you started with modular programming, your program should include a subfunction out = getc(x, t, k) that returns the value of c(x, t) for some position x and time t using k terms in the sum. Explain what happens to the behavior of the plot as a function of k. Also explain why the difference between the sum and the initial condition is different at x = () and x=1. Consider the function 4(-1)" c(x, t) = COS [2, 4, 1928) exp [-(2n 1) ) ?] 1=(2n + 1) for the concentration profile as a function of time. In practice, we need to truncate the sum with a finite number terms, c(x,t) = 4(-1)" (2n + 1) COS [(21 + )Ax] exp | exp[-(2, 3 D.)?] n=0 (a) Some functions are very difficult to represent as a Fourier series. The initial condition for this problem is one such function. Write a MATLAB program that automatically plots the value of c(x,0) for different values of k. It is convenient to use the linspace function in MATLAB to generate values of x for this problem. You should choose values of k that illustrate the difficulty in making the plot. To help get you started with modular programming, your program should include a subfunction out = getc(x, t, k) that returns the value of c(x, t) for some position x and time t using k terms in the sum. Explain what happens to the behavior of the plot as a function of k. Also explain why the difference between the sum and the initial condition is different at x = () and x=1


