Answered step by step
Verified Expert Solution
Question
1 Approved Answer
Project 1: Melting of the Ice Caps Background: Over 90% of Earth's ice mass is locked up in Greenland and Antarctica. Due to global
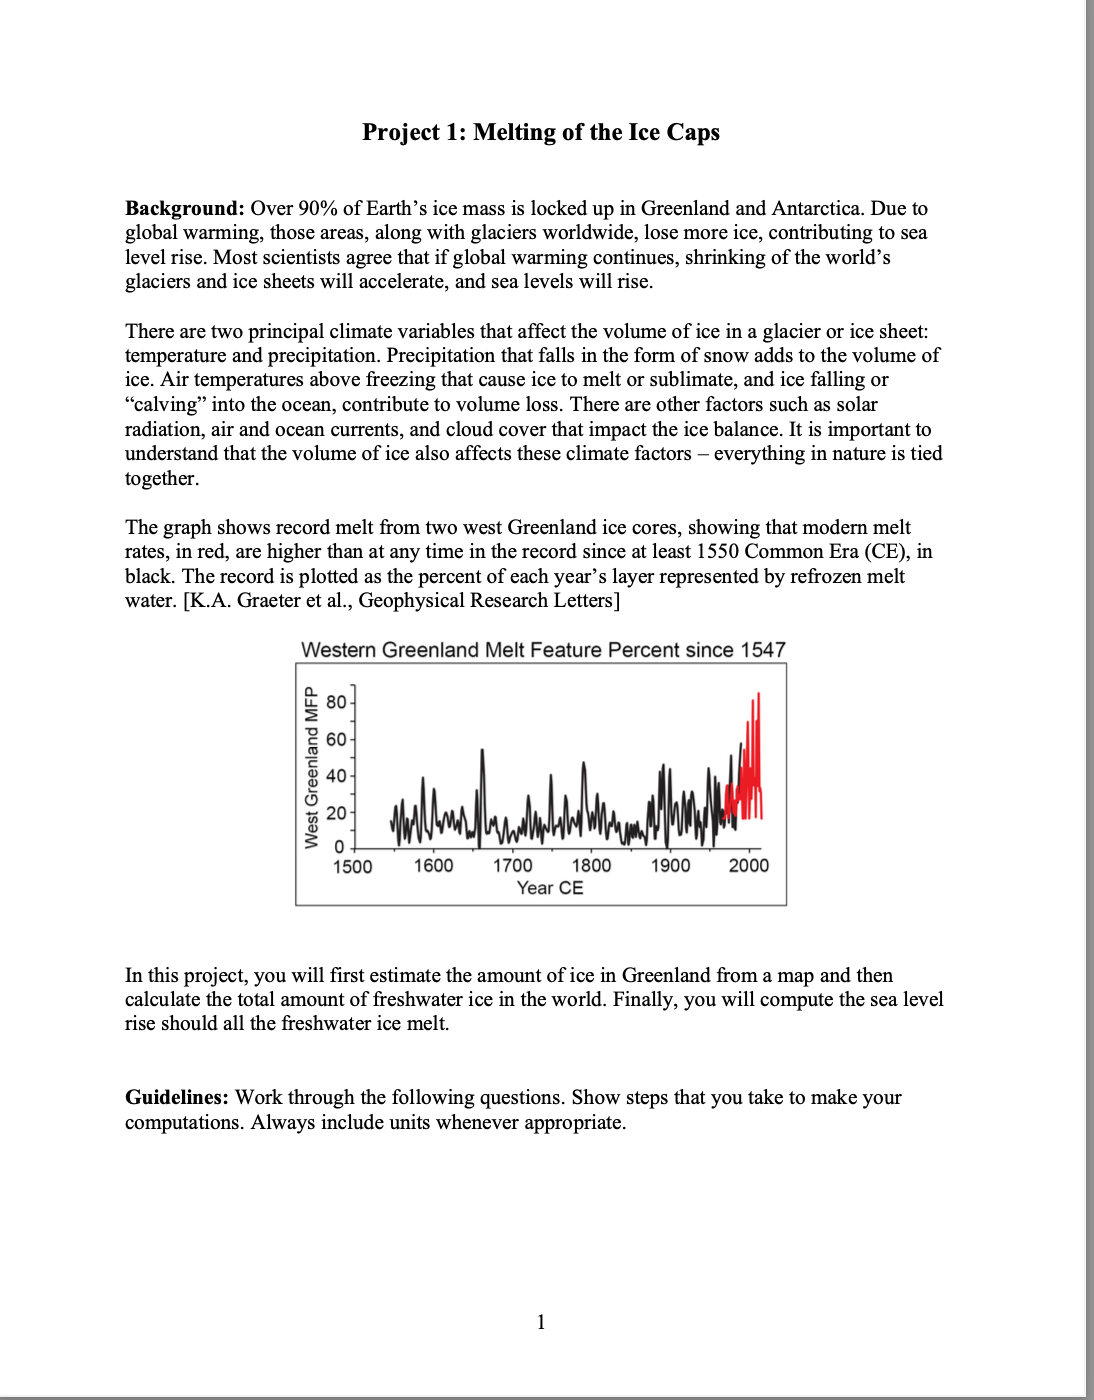
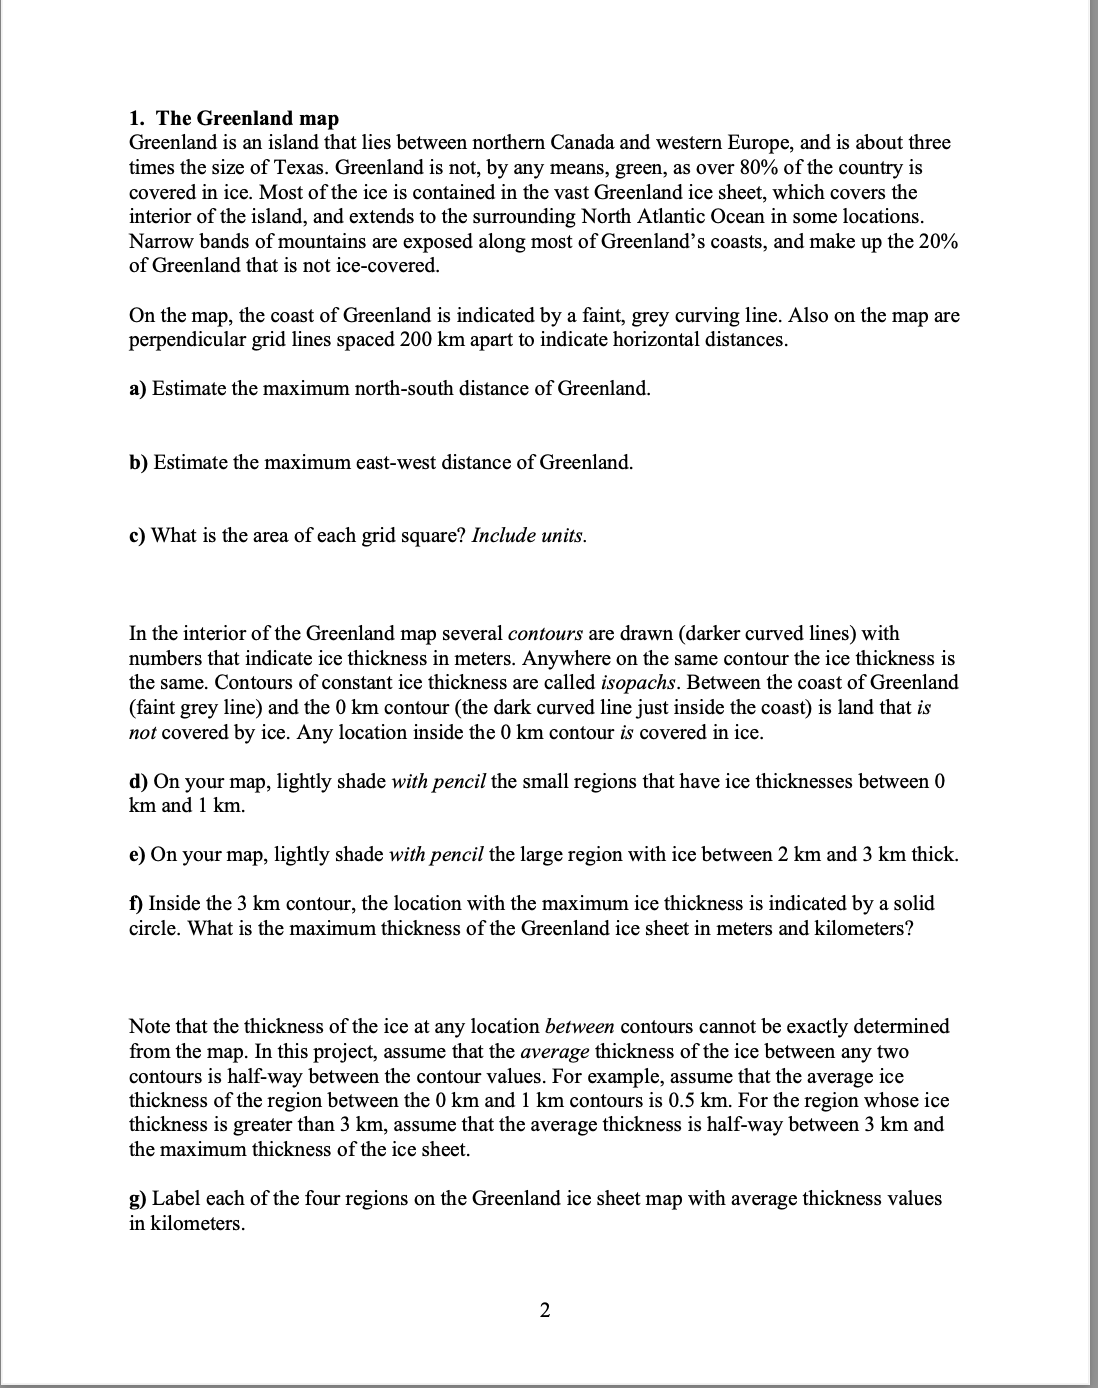
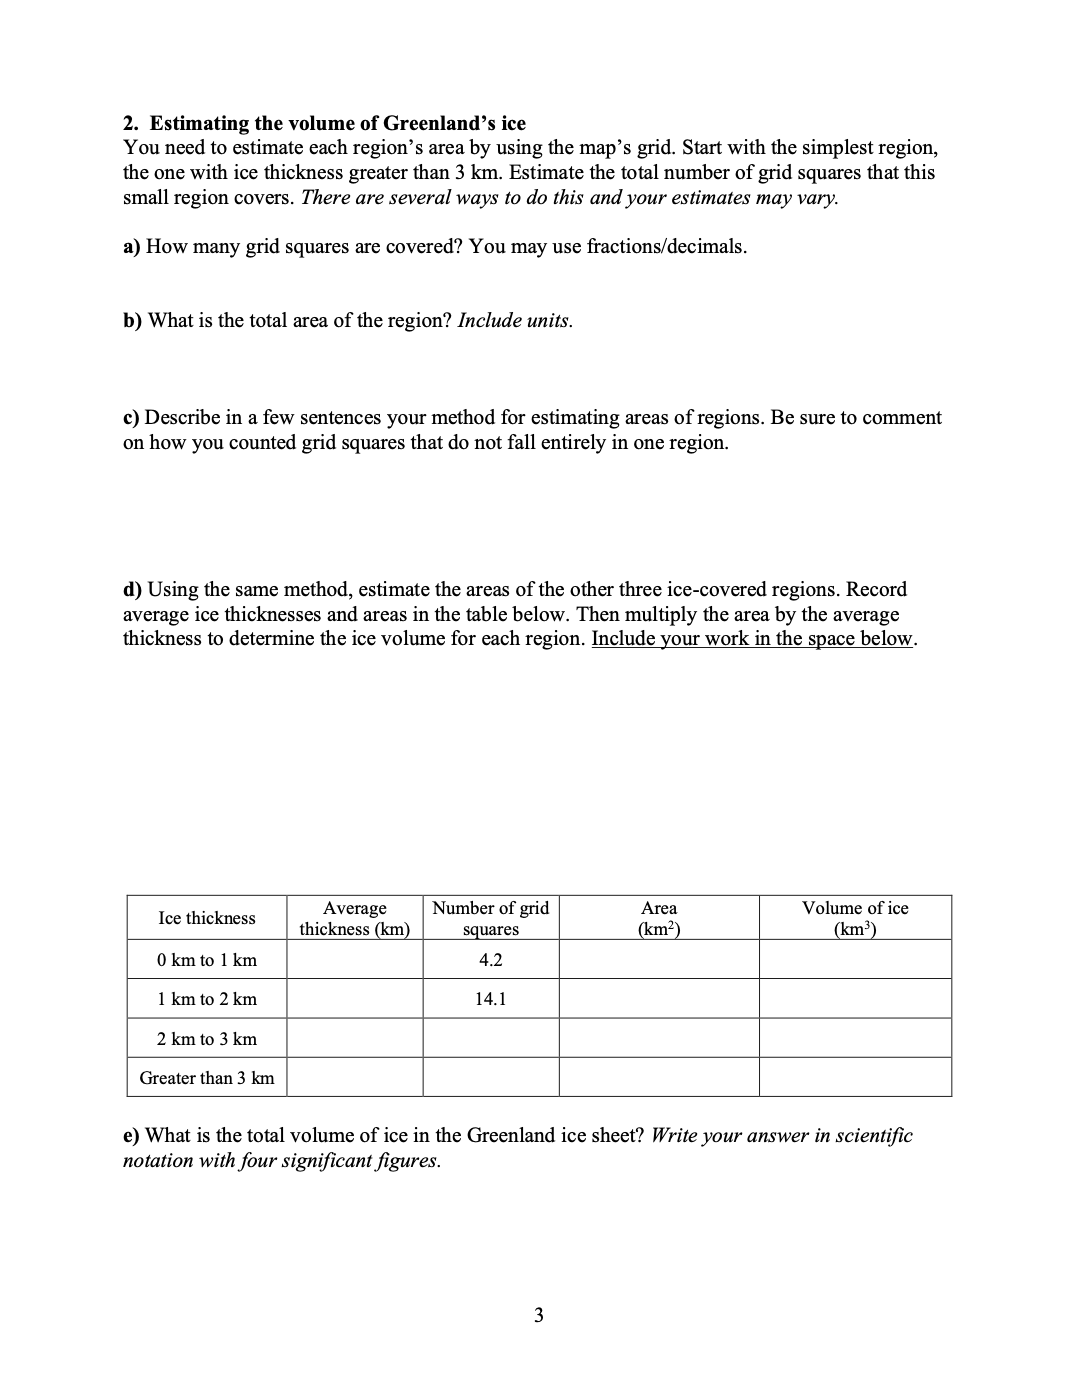
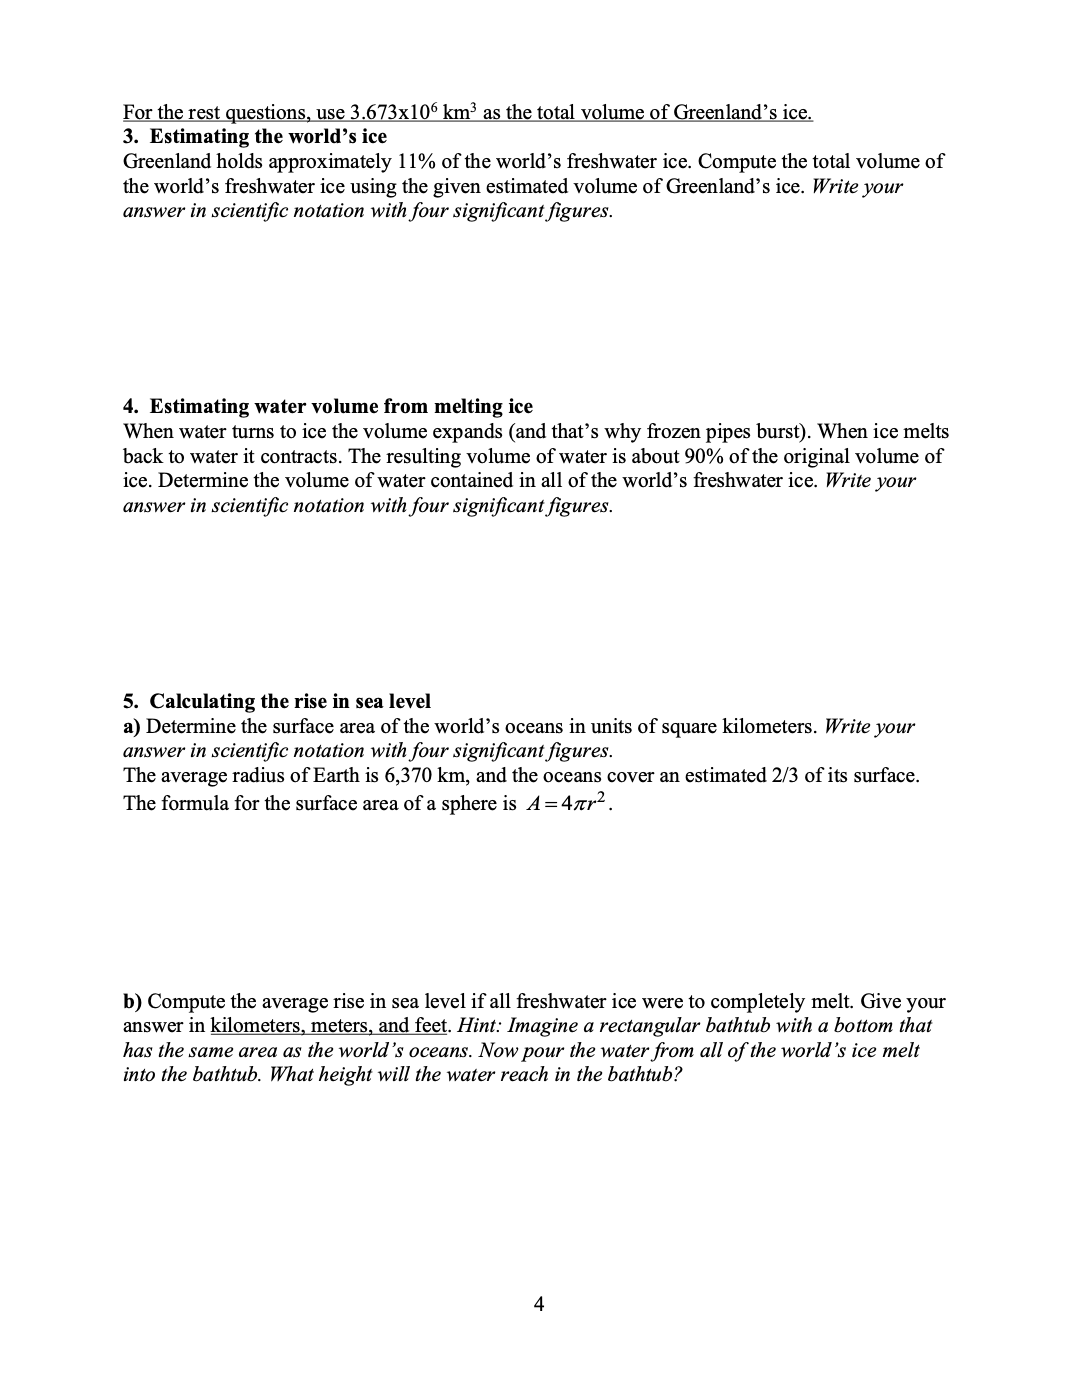
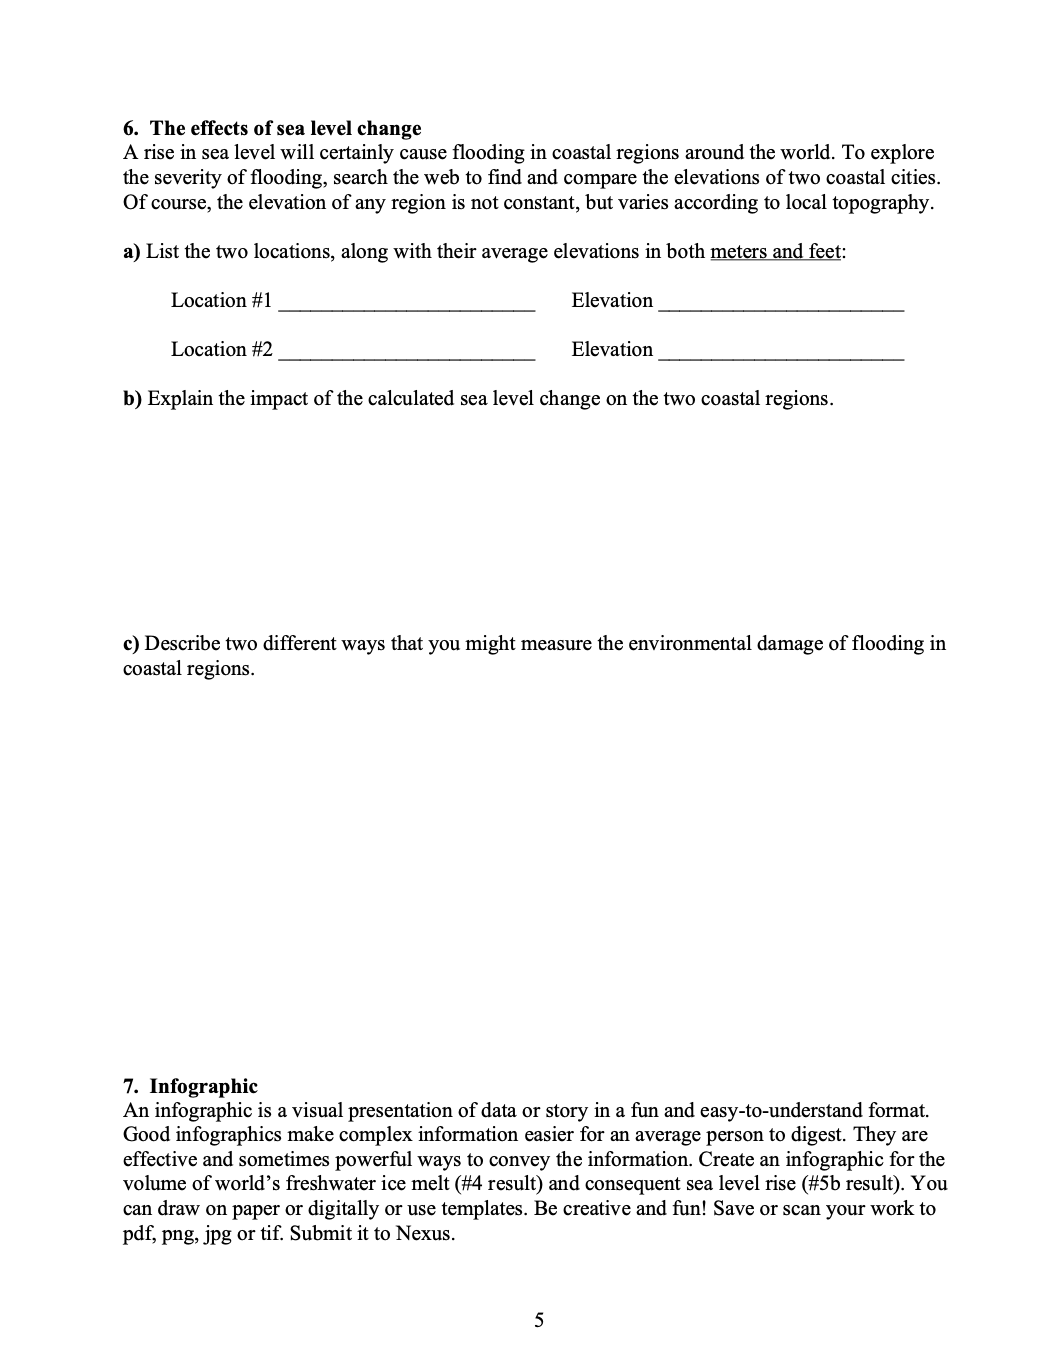
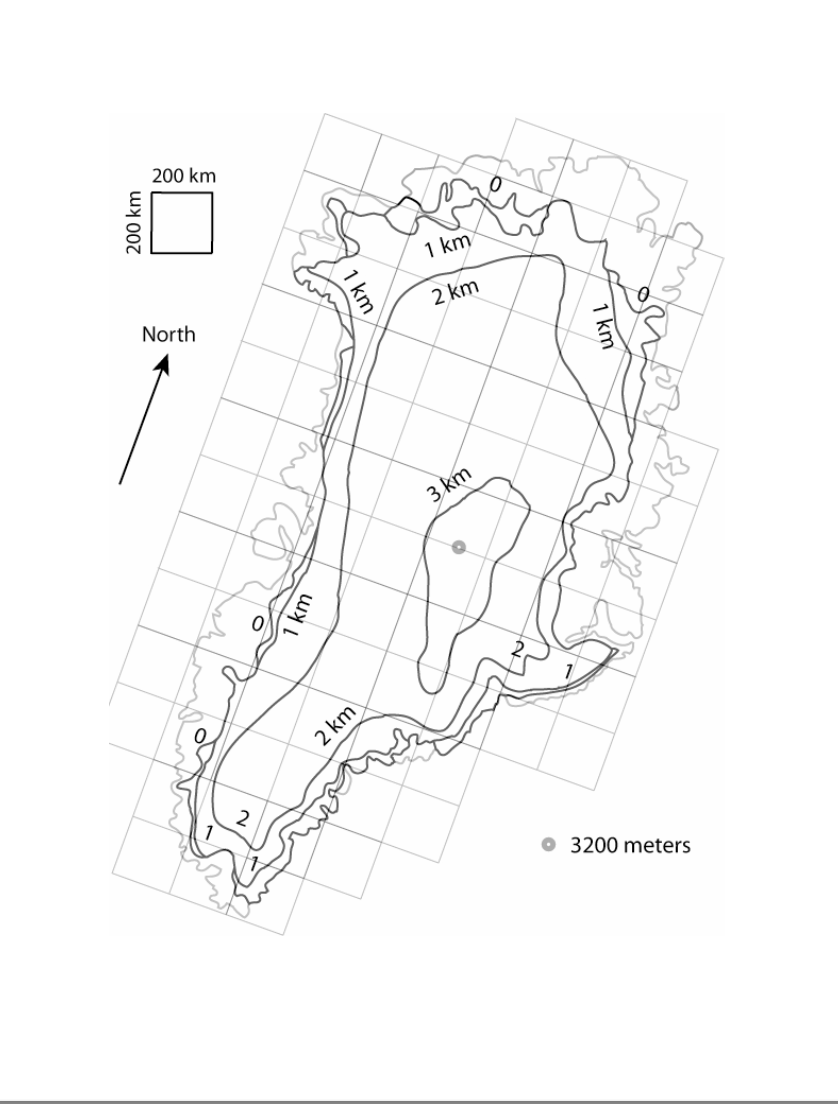
Project 1: Melting of the Ice Caps Background: Over 90% of Earth's ice mass is locked up in Greenland and Antarctica. Due to global warming, those areas, along with glaciers worldwide, lose more ice, contributing to sea level rise. Most scientists agree that if global warming continues, shrinking of the world's glaciers and ice sheets will accelerate, and sea levels will rise. There are two principal climate variables that affect the volume of ice in a glacier or ice sheet: temperature and precipitation. Precipitation that falls in the form of snow adds to the volume of ice. Air temperatures above freezing that cause ice to melt or sublimate, and ice falling or "calving" into the ocean, contribute to volume loss. There are other factors such as solar radiation, air and ocean currents, and cloud cover that impact the ice balance. It is important to understand that the volume of ice also affects these climate factors - everything in nature is tied together. The graph shows record melt from two west Greenland ice cores, showing that modern melt rates, in red, are higher than at any time in the record since at least 1550 Common Era (CE), in black. The record is plotted as the percent of each year's layer represented by refrozen melt water. [K.A. Graeter et al., Geophysical Research Letters] Western Greenland Melt Feature Percent since 1547 West Greenland MFP - 0 1500 1600 1700 1800 1900 2000 Year CE In this project, you will first estimate the amount of ice in Greenland from a map and then calculate the total amount of freshwater ice in the world. Finally, you will compute the sea level rise should all the freshwater ice melt. Guidelines: Work through the following questions. Show steps that you take to make your computations. Always include units whenever appropriate. 1 1. The Greenland map Greenland is an island that lies between northern Canada and western Europe, and is about three times the size of Texas. Greenland is not, by any means, green, as over 80% of the country is covered in ice. Most of the ice is contained in the vast Greenland ice sheet, which covers the interior of the island, and extends to the surrounding North Atlantic Ocean in some locations. Narrow bands of mountains are exposed along most of Greenland's coasts, and make up the 20% of Greenland that is not ice-covered. On the map, the coast of Greenland is indicated by a faint, grey curving line. Also on the map are perpendicular grid lines spaced 200 km apart to indicate horizontal distances. a) Estimate the maximum north-south distance of Greenland. b) Estimate the maximum east-west distance of Greenland. c) What is the area of each grid square? Include units. In the interior of the Greenland map several contours are drawn (darker curved lines) with numbers that indicate ice thickness in meters. Anywhere on the same contour the ice thickness is the same. Contours of constant ice thickness are called isopachs. Between the coast of Greenland (faint grey line) and the 0 km contour (the dark curved line just inside the coast) is land that is not covered by ice. Any location inside the 0 km contour is covered in ice. d) On your map, lightly shade with pencil the small regions that have ice thicknesses between 0 km and 1 km. e) On your map, lightly shade with pencil the large region with ice between 2 km and 3 km thick. f) Inside the 3 km contour, the location with the maximum ice thickness is indicated by a solid circle. What is the maximum thickness of the Greenland ice sheet in meters and kilometers? Note that the thickness of the ice at any location between contours cannot be exactly determined from the map. In this project, assume that the average thickness of the ice between any two contours is half-way between the contour values. For example, assume that the average ice thickness of the region between the 0 km and 1 km contours is 0.5 km. For the region whose ice thickness is greater than 3 km, assume that the average thickness is half-way between 3 km and the maximum thickness of the ice sheet. g) Label each of the four regions on the Greenland ice sheet map with average thickness values in kilometers. 2 2. Estimating the volume of Greenland's ice You need to estimate each region's area by using the map's grid. Start with the simplest region, the one with ice thickness greater than 3 km. Estimate the total number of grid squares that this small region covers. There are several ways to do this and your estimates may vary. a) How many grid squares are covered? You may use fractions/decimals. b) What is the total area of the region? Include units. c) Describe in a few sentences your method for estimating areas of regions. Be sure to comment on how you counted grid squares that do not fall entirely in one region. d) Using the same method, estimate the areas of the other three ice-covered regions. Record average ice thicknesses and areas in the table below. Then multiply the area by the average thickness to determine the ice volume for each region. Include your work in the space below. Ice thickness Average thickness (km) Number of grid squares Area (km) Volume of ice (km) 0 km to 1 km 4.2 1 km to 2 km 14.1 2 km to 3 km Greater than 3 km e) What is the total volume of ice in the Greenland ice sheet? Write your answer in scientific notation with four significant figures. 3 For the rest questions, use 3.673x10⁶ km as the total volume of Greenland's ice. 3. Estimating the world's ice Greenland holds approximately 11% of the world's freshwater ice. Compute the total volume of the world's freshwater ice using the given estimated volume of Greenland's ice. Write your answer in scientific notation with four significant figures. 4. Estimating water volume from melting ice When water turns to ice the volume expands (and that's why frozen pipes burst). When ice melts back to water it contracts. The resulting volume of water is about 90% of the original volume of ice. Determine the volume of water contained in all of the world's freshwater ice. Write your answer in scientific notation with four significant figures. 5. Calculating the rise in sea level a) Determine the surface area of the world's oceans in units of square kilometers. Write your answer in scientific notation with four significant figures. The average radius of Earth is 6,370 km, and the oceans cover an estimated 2/3 of its surface. The formula for the surface area of a sphere is A=4r. b) Compute the average rise in sea level if all freshwater ice were to completely melt. Give your answer in kilometers, meters, and feet. Hint: Imagine a rectangular bathtub with a bottom that has the same area as the world's oceans. Now pour the water from all of the world's ice melt into the bathtub. What height will the water reach in the bathtub? 4 6. The effects of sea level change A rise in sea level will certainly cause flooding in coastal regions around the world. To explore the severity of flooding, search the web to find and compare the elevations of two coastal cities. Of course, the elevation of any region is not constant, but varies according to local topography. a) List the two locations, along with their average elevations in both meters and feet: Location #1 Location #2 Elevation Elevation b) Explain the impact of the calculated sea level change on the two coastal regions. c) Describe two different ways that you might measure the environmental damage of flooding in coastal regions. 7. Infographic An infographic is a visual presentation of data or story in a fun and easy-to-understand format. Good infographics make complex information easier for an average person to digest. They are effective and sometimes powerful ways to convey the information. Create an infographic for the volume of world's freshwater ice melt (#4 result) and consequent sea level rise (#5b result). You can draw on paper or digitally or use templates. Be creative and fun! Save or scan your work to pdf, png, jpg or tif. Submit it to Nexus. 5 200 km 200 km North 1 km 2 km 1 km 3 km 1 km 2 km 3200 meters 1 km
Step by Step Solution
There are 3 Steps involved in it
Step: 1

Get Instant Access to Expert-Tailored Solutions
See step-by-step solutions with expert insights and AI powered tools for academic success
Step: 2

Step: 3

Ace Your Homework with AI
Get the answers you need in no time with our AI-driven, step-by-step assistance
Get Started


