Project 3: Thermal Fatigue of Solder Interconnects Group#: What happens to an electronic package when it is subjected to repeated temperature changes? This question

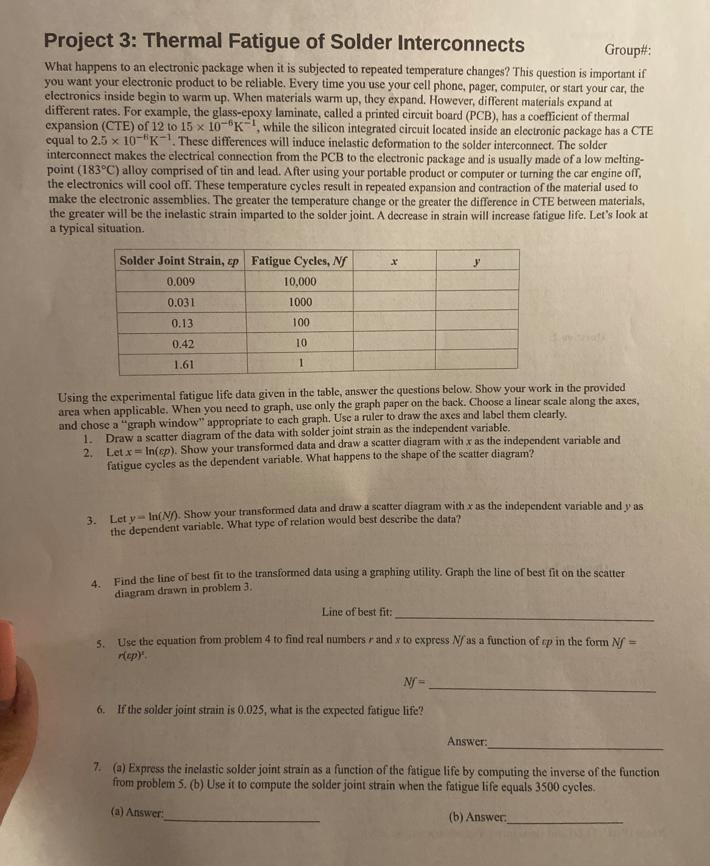
Project 3: Thermal Fatigue of Solder Interconnects Group#: What happens to an electronic package when it is subjected to repeated temperature changes? This question is important if you want your electronic product to be reliable. Every time you use your cell phone, pager, computer, or start your car, the electronics inside begin to warm up. When materials warm up, they expand. However, different materials expand at different rates. For example, the glass-epoxy laminate, called a printed circuit board (PCB), has a coefficient of thermal expansion (CTE) of 12 to 15 x 10-K, while the silicon integrated circuit located inside an electronic package has a CTE equal to 2.5 x 10-"K-1. These differences will induce inelastic deformation to the solder interconnect. The solder interconnect makes the electrical connection from the PCB to the electronic package and is usually made of a low melting- point (183C) alloy comprised of tin and lead. After using your portable product or computer or turning the car engine off, the electronics will cool off. These temperature cycles result in repeated expansion and contraction of the material used to make the electronic assemblies. The greater the temperature change or the greater the difference in CTE between materials, the greater will be the inelastic strain imparted to the solder joint. A decrease in strain will increase fatigue life. Let's look at a typical situation. Solder Joint Strain, ep Fatigue Cycles, Nf 0.009 10,000 0.031 1000 0.13 100 0.42 10 1.61 1 X Using the experimental fatigue life data given in the table, answer the questions below. Show your work in the provided area when applicable. When you need to graph, use only the graph paper on the back. Choose a linear scale along the axes, and chose a "graph window" appropriate to each graph. Use a ruler to draw the axes and label them clearly. 1. Draw a scatter diagram of the data with solder joint strain as the independent variable. y 2. Let x-In(ep). Show your transformed data and draw a scatter diagram with x as the independent variable and fatigue cycles as the dependent variable. What happens to the shape of the scatter diagram? 3. Let y-In(N). Show your transformed data and draw a scatter diagram with x as the independent variable and y as the dependent variable. What type of relation would best describe the data? 4. Find the line of best fit to the transformed data using a graphing utility. Graph the line of best fit on the scatter diagram drawn in problem 3. Line of best fit: 5. Use the equation from problem 4 to find real numbers r and x to express Nf as a function of rp in the form Nf= r(ep)'. Nf= 6. If the solder joint strain is 0.025, what is the expected fatigue life? Answer: 7. (a) Express the inelastic solder joint strain as a function of the fatigue life by computing the inverse of the function from problem 5. (b) Use it to compute the solder joint strain when the fatigue life equals 3500 cycles. (a) Answer: (b) Answer:
Step by Step Solution
3.55 Rating (165 Votes )
There are 3 Steps involved in it
Step: 1
1 Scatter Dagram with solder strain as independent variable solder joint Strain ep w...
See step-by-step solutions with expert insights and AI powered tools for academic success
Step: 2

Step: 3

Ace Your Homework with AI
Get the answers you need in no time with our AI-driven, step-by-step assistance
Get Started


