Answered step by step
Verified Expert Solution
Link Copied!

Question

1 Approved Answer

Project 5 Cubic Spline (due on: April 12) Given the following data point: (-2, 13), (-1, 5), (0, 7), (1, 12), (2, 29), using cubic
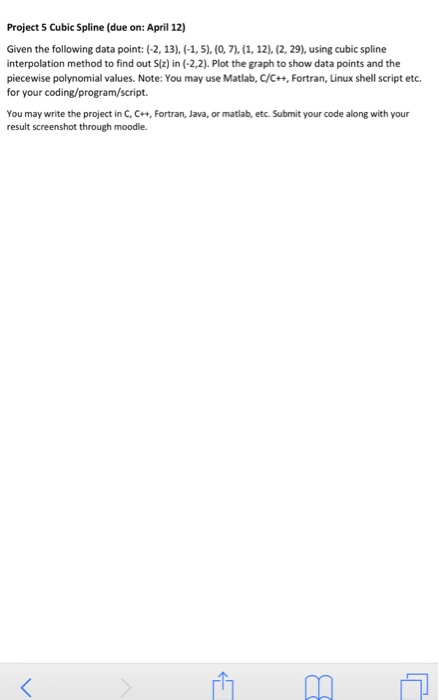
image text in transcribed
Project 5 Cubic Spline (due on: April 12) Given the following data point: (-2, 13), (-1, 5), (0, 7), (1, 12), (2, 29), using cubic spline interpolation method to find out Sz) in (-2,2). Plot the graph to show data points and the piecewise polynomial values. Note: You may use Matlab, C/C++, Fortran, Linux shell script etc. for your coding/program/script. You may write the project in C, , Fortran, Java, or matlab, etc. Submit your code along with your result screenshot through moodle

Step by Step Solution

There are 3 Steps involved in it

Step: 1

blur-text-image

Get Instant Access to Expert-Tailored Solutions

See step-by-step solutions with expert insights and AI powered tools for academic success

Step: 2

blur-text-image_2

Step: 3

blur-text-image_3

Ace Your Homework with AI

Get the answers you need in no time with our AI-driven, step-by-step assistance

Get Started

Recommended Textbook for

Machine Learning And Knowledge Discovery In Databases European Conference Ecml Pkdd 2010 Barcelona Spain September 2010 Proceedings Part 3 Lnai 6323

Authors: Jose L. Balcazar ,Francesco Bonchi ,Aristides Gionis ,Michele Sebag

2010th Edition

3642159389, 978-3642159381

More Books

Students also viewed these Databases questions

Question

Why do cout Answered: 1 week ago

Answered: 1 week ago

Question

7. Understand the challenges of multilingualism.

Answered: 1 week ago

Question

5. Give examples of variations in contextual rules.

Answered: 1 week ago