Project: Analyzing Driving Data Step 1: Prepare for the project. Read the entire Student Guide before you begin. If anything is unclear, be sure to
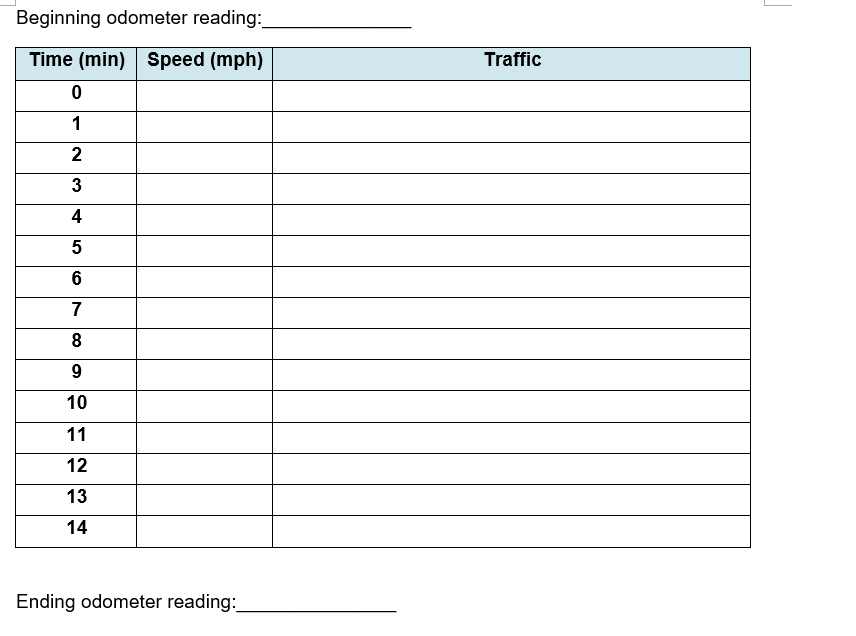
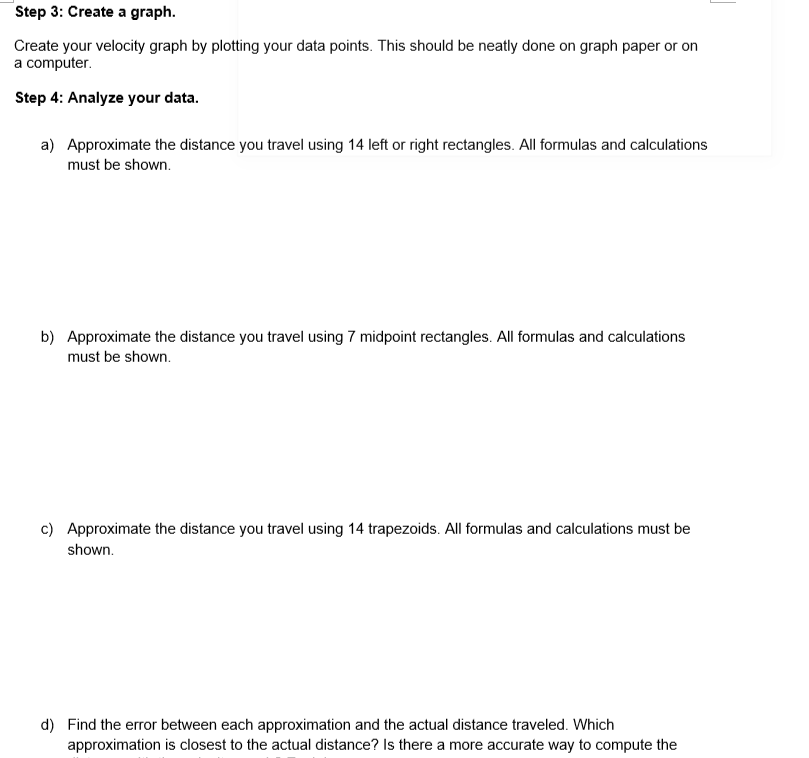
Project: Analyzing Driving Data Step 1: Prepare for the project. Read the entire Student Guide before you begin. If anything is unclear, be sure to ask your teacher for assistance. Step 2: Collect data. Cars are equipped with instruments to measure both position and velocity. Recording mileage from the odometer gives position while the speedometer shows instantaneous velocity. In groups of three, go for a \"minute drive. The designated driver's only job is to drive. The choice of the type of course is up to you, but should include a variety of driving conditions. The other occupants of the vehicle will collect and record the data needed to complete the project. N0 TE: ll you are unable to collect the data with classmates, you may have parents, guardians, friends, or family members help you. lf that is not possible, ask your teacher to provide you with data. To collect the data, follow these instructions: a) There should be three people in the car. One person (the Driver) is only responsible for driving and should not attempt to help with any other duties. Another person (the Timer) will watch the timer and call out speedometer readings. The third person (the Recorder) will record the data. b) At the start of the 14minute time interval, set your trip odometer to zero. Alternatively, you can record the exact odometer reading. c} Don't start the 14 minutes when you start the drive. Instead, wait until the car is moving well. At this point, the Timer will start the timer and call out the speed, while the Recorder will write down the speed in the space by time zero. d) The Timer will call out speedometer readings at oneminute [onthe-minute) intervals. e) The Recorder will record the time and velocity data at each interval on the chart below. f) Between speedometer readings the recorder should make notes about the traic conditions (stop and g0, steady, etc). g) At the end of the 14 minutes, record the exact odometer reading. \fStop 3: Create a graph. Create yOur velocity graph by plotting your data points This should be neatly done on graph paper or on a computer. Stop 4: Analyze your data. a) Approximate the distance you travel using 14 left or right rectangles. All formulas and calculations must be shown. b) Approximate the distance you travel using 7 midpoint rectangles. All formulas and calculations must be shown. c) Approximate the distance you travel using 14 trapezoids. All formulas and calculations must be shown. d) Find the error between each approximation and the actual distance traveled. Which approximation is closest to the actual distance? Is there a more accurate way to compute the
Step by Step Solution
There are 3 Steps involved in it
Step: 1
Get Instant Access to Expert-Tailored Solutions
See step-by-step solutions with expert insights and AI powered tools for academic success
Step: 2
Step: 3
Ace Your Homework with AI
Get the answers you need in no time with our AI-driven, step-by-step assistance