

Question
Project Description: As a weather analyst, you have been tracking daily high and low temperatures for Oklahoma City, Tulsa, and Lawton during June, with each
Project Description:
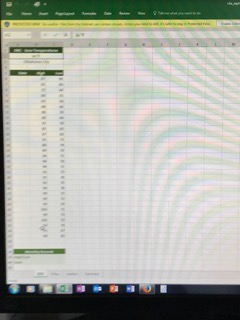
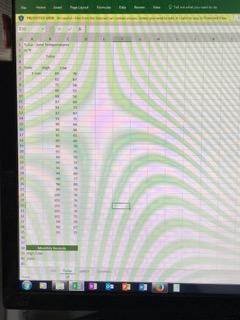
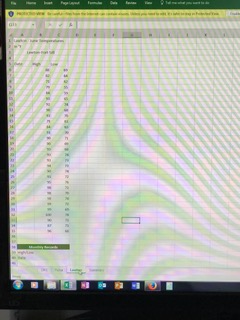
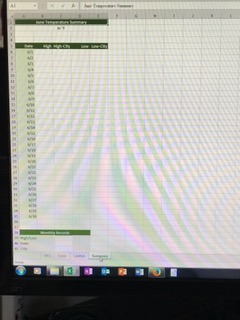
As a weather analyst, you have been tracking daily high and low temperatures for Oklahoma City, Tulsa, and Lawton during June, with each citys data stored in its own worksheet. You need to apply consistent formatting and enter formulas for all worksheets. You need to create the summary worksheet to identify the record high and low temperatures by day and identify the respective cities.
Instructions:
For the purpose of grading the project you are required to perform the following tasks:
| Step | Instructions | Points Possible |
|---|---|---|
| 1 | Open the downloaded workbook named exploring_e09_grader_h3_June.xlsx and save it as exploring_e09_grader_h3_June_LastFirst. | 0.000 |
| 2 | Group the city worksheets. Fill the formatting of cells A1, A2, and A5:C5 from the OKC worksheet to the other city worksheets. | 6.000 |
| 3 | Enter dates 6/1 to 6/30 in this date format (no year) in the Date column. Apply Green, Accent 6, Lighter 60% fill to the dates. | 12.000 |
| 4 | Enter a function in cell B39 to calculate the highest temperature of the month. Enter a function in cell C39 to calculate the lowest temperature of the month. | 9.000 |
| 5 | Use a nested MATCH function within the INDEX function in cell B40 to identify the date for the highest temperature. The dataset may contain several identical highest temperatures, but the nested function will identify the first date containing the match. | 8.000 |
| 6 | Use a nested MATCH function within the INDEX function in cell C40 to identify the date for the lowest temperature. Ungroup the worksheets. | 8.000 |
| 7 | Use a Web browser to go to www.wunderground.com, a weather Web site. At the top of the page, click More, click Historical Weather and submit a search for OKC, Oklahoma. Copy the URL and create a hyperlink to this Web page for cell A3 in the OKC worksheet. Add a ScreenTip stating Click to see weather history for Oklahoma City (no period). | 5.000 |
| 8 | Create hyperlinks for the Tulsa (hyperlink text is Tulsa) and Lawton (hyperlink text is Lawton-Fort Sill) worksheets as well (in cell A3). Set the ScreenTips as Click to see weather history for Tulsa (no period) and Click to see weather history for Lawton (no period). Continue to use www.wunderground.com for the weather links. Check each hyperlink to ensure it works correctly. | 10.000 |
| 9 | In cell B6 in the Summary sheet, enter a 3-D formula to calculate the highest temperature from the three cities for 6/1. Copy the formula down the High column. | 8.000 |
| 10 | In cell D6 in the Summary sheet, enter a 3-D formula to calculate the lowest temperature from the three cities for 6/1. Copy the formula down the Low column. | 8.000 |
| 11 | In cell C6 in the Summary sheet, enter a nested IF function to determine which city had the highest temperature. Based on the result returned in B6, enter the city name as OKC or Tulsa or Lawton in C6. Remember to enclose city names in double quotation marks in the function. Use Help if needed to help you understand a nested IF statement. Copy the formula down the High-City column. | 6.000 |
| 12 | In cell E6 in the Summary sheet, enter a nested IF function to determine which city had the lowest temperature. Based on the result returned in D6, enter the city name as OKC or Tulsa or Lawton in E6. Copy the function down the Low-City column. | 6.000 |
| 13 | In the Summary sheet, enter functions in the shaded Monthly Records section (below the daily data) to identify the highest (in column B) and lowest temperature (in column D). | 5.000 |
| 14 | Enter nested INDEX and MATCH functions to identify the dates and cities for the respective highest and lowest temperatures. | 5.000 |
| 15 | Create a footer with your name on the left side, the sheet name code in the center, and the file name code on the right side of each worksheet. Select the option to center the worksheet data horizontally on each sheet. | 4.000 |
| 16 | Ensure that the worksheets are correctly named and placed in the following order in the workbook: OKC, Tulsa, Lawton, and Summary. Save and close the workbook, and submit the file as directed. | 0.000 |
|
| Total Points | 100.000 |
Step by Step Solution
There are 3 Steps involved in it
Step: 1

Get Instant Access to Expert-Tailored Solutions
See step-by-step solutions with expert insights and AI powered tools for academic success
Step: 2

Step: 3
Ace Your Homework with AI
Get the answers you need in no time with our AI-driven, step-by-step assistance
Get Started
PostgreSQL 10 High Performance Expert Techniques For Query Optimization High Availability And Efficient Database Maintenance
Authors: Ibrar Ahmed ,Gregory Smith ,Enrico Pirozzi
3rd Edition
1788474481, 978-1788474481