

Question
Project One Your project must be submitted in both RMarkdown and Word formats. Projects submitted in other formats will not be graded. During this project
Project One
Your project must be submitted in both RMarkdown and Word formats. Projects submitted in other formats will not be graded. During this project you will produce a paper presenting an application of statistical methods to the data described below. The paper should not exceed 3 pages, including figures and tables, and must begin with an appropriate title highlighting the topic and analysis. Keep in mind that the report should be written for a particular audience: your own supervisor in the Data Science team, who may use some of your results in a presentation to their supervisors (not in the Data Science team).
The Data and The Questions
You are working as a data scientist for a social media startup company. The platform allows users to post text and images, viewable by thousands of other users. In an effort to drive continued engagement on the platform, the company leadership is considering changing its current model, where users can upload an unlimited number of posts, to a more limited model, where users can only make a small number of posts per day. The company leadership believes that such a change would increase the perceived quality of content, thus encouraging users to continue using the platform.
In order to determine whether this change has a positive effect on engagement, a collection of new users were randomly assigned to one of the two models, either unlimited or limited posting. The following information was recorded for each of these new users:
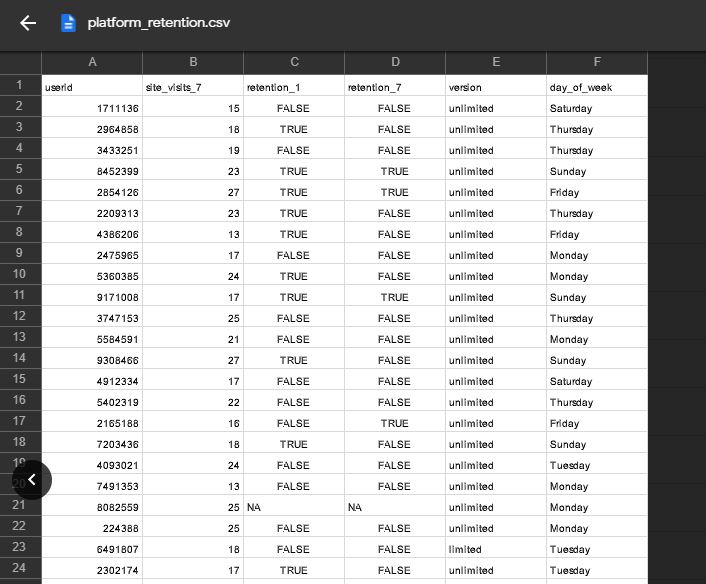
- `userid`: numeric; unique user identification number
- `site_visits_7`: numeric; the number of site visits in the first 7 days after registering
- `retention_1`: logical; whether the user accessed the platform one day after registering
- `retention_7`: logical; whether the user accessed the platform 7 days after registering
- `version`: character; which posting model was assigned to the user
- `day_of_week`: character; day of week when user registered
The data can be found in the file `platform_retention.csvDownload platform_retention.csv`. The primary metric of interest in this study is 7-day retention. The primary question of interest is whether limiting user posts increases 7-day retention when compared to the unlimited posting model. However, company leadership also recognizes that changing the posting model for existing users may have negative effects on retention for those users. As such, your supervisor has asked you to avoid claiming a significant improvement unless the data strongly supports the claim, both in statistical and practical significance.
In addition to this question, your supervisor has asked you to also address the following questions/concerns:
- Does the number of site visits by day 7 differ between the two posting models?
- Does 1-day retention differ between the two posting models?
- Is there any other relationship between the recorded variables that warrants further investigation in the next testing phase?
Additional Resources and Tips
- Consider your audience. Clean graphics and explanations are more important than the code used to generate them. Suppress code whereever possible (exceptions include unique approaches or complicated data manipulations).
- Here is a good example of a logistic regression project, unrelated to this class, that will give you an idea of what we expect in your final report: https://rpubs.com/mudassirkhan19/regression-model. This report includes a good narrative that guides the reader and highlights the results. This report would receive a grade of A in our class. However, it isn't really necessary to show exactly how every plot is produced unless the code is very unusual.
- Here is an example of a report which would likely earn a grade of B: https://rpubs.com/cheverne/titanic_survival_logisticreg_svm This report doesn't hide any of the unnecessary output and the narrative doesn't really serve to highlight the results and analysis. Instead the narrative just kind of tells us what the author did at each stage but doesn't explain why and doesn't focus on the highlights.
- While this project only scratches the surface of A/B testing, you might find the following post detailing more of the process interesting:https:/etflixtechblog.com/experimentation-is-a-major-focus-of-data-science-across-netflix-f67923f8e985(Links to an external site.)
plateform_retention.csv data looks like this:
Step by Step Solution
There are 3 Steps involved in it
Step: 1

Get Instant Access to Expert-Tailored Solutions
See step-by-step solutions with expert insights and AI powered tools for academic success
Step: 2

Step: 3
Ace Your Homework with AI
Get the answers you need in no time with our AI-driven, step-by-step assistance
Get Started
Convex Optimization
Authors: Stephen Boyd, Lieven Vandenberghe
1st Edition
1107299527, 9781107299528