Answered step by step
Verified Expert Solution
Question
1 Approved Answer
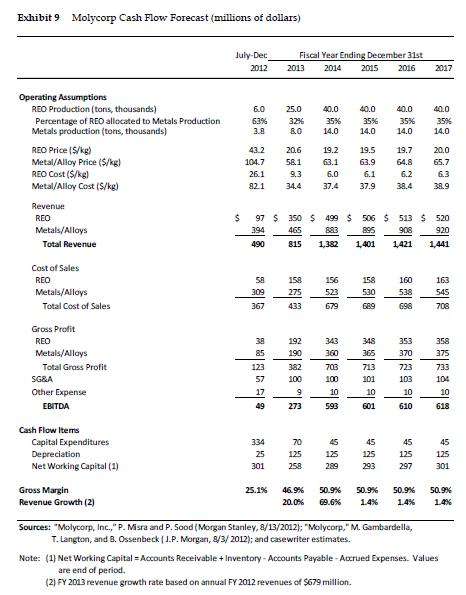
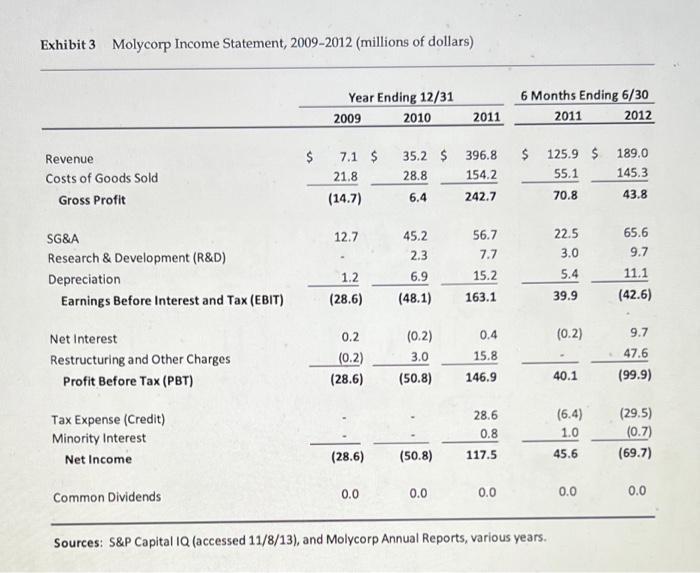
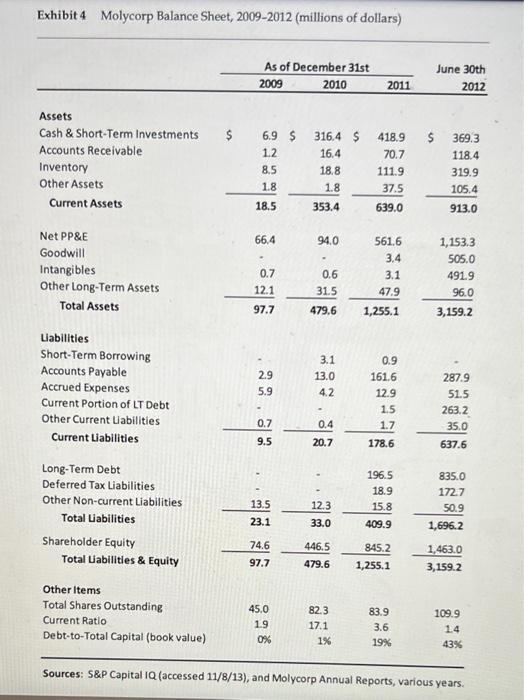
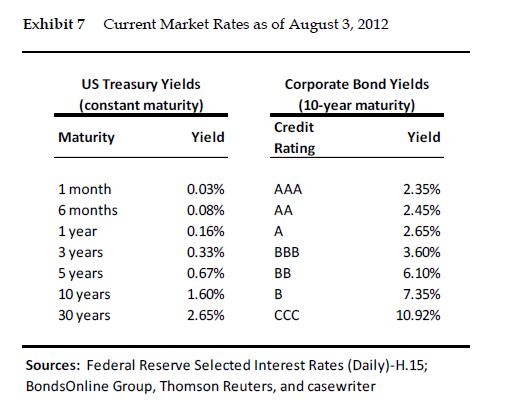
Project out or Forecast Molycorp's financials from 2012 to 2017 and determine its funding needs from 2012 to 2017 with the help of following exhibits.
Project out or Forecast Molycorp's financials from 2012 to 2017 and determine its funding needs from 2012 to 2017 with the help of following exhibits.


Exhibit 9 Molycorp Cash Flow Forecast (millions of dollars) Operating Assumptions REO Production (tons, thousands) Percentage of REO allocated to Metals Production Metals production (tons, thousands) REO Price ($/kg) Metal/Alloy Price ($/kg) REO Cost ($/kg) Metal/Alloy Cost (S/kg) Revenue REO Metals/Alloys Total Revenue Cost of Sales REO Metals/Alloys Total Cost of Sales Gross Profit REO Metals/Alloys Total Grass Profit SG&A Other Expense EBITDA Cash Flow Items Capital Expenditures Depreciation Net Working Capital (1) Gross Margin Revenue Growth (2) July-Dec 2012 $ 6.0 63% 3.8 43.2 104.7 26.1 82.1 58 309 367 ****** 334 25 301 Fiscal Year Ending December 31st 2014 2015 2016 25.1% 2013 25.0 32% 80 20.6 58.1 9.3 34.4 158 275 433 192 190 40.0 40.0 40.0 35% 35% 14.0 14.0 815 1,382 273 19.2 63.1 6.0 37.4 70 125 258 97 $ 350 $ 499 $ 506 $513 $520 394 465 908 920 490 1,421 1,441 156 5.23 679 382 703 100 100 9 343 360 883 895 98 35% 593 14.0 45 125 289 19.5 63.9 6.1 37.9 *** *** **** 19.7 64.8 6.2 38.4 45 125 293 160 538 696 353 370 723 103 10 610 45 125 297 46.9% 50.9% 50.9% 50.9% 20.0% 69.6% 1.4% 1.4% 2017 Sources: "Molycorp, Inc.," P. Misra and P. Sood (Morgan Stanley, 8/13/2012); "Molycorp," M. Gambardella, T. Langton, and B. Ossenbeck (J.P. Morgan, 8/3/2012); and casewriter estimates. 40.0 35% 14.0 20.0 65.7 6.3 38.9 163 545 708 358 375 733 104 10 618 45 125 301 50.9% 1.4% Note: (1) Net Working Capital Accounts Receivable + Inventory-Accounts Payable-Accrued Expenses. Values are end of period. (2) FY 2013 revenue growth rate based on annual FY 2012 revenues of $679 million.
Step by Step Solution
★★★★★
3.45 Rating (165 Votes )
There are 3 Steps involved in it
Step: 1

Get Instant Access to Expert-Tailored Solutions
See step-by-step solutions with expert insights and AI powered tools for academic success
Step: 2

Step: 3

Ace Your Homework with AI
Get the answers you need in no time with our AI-driven, step-by-step assistance
Get Started


