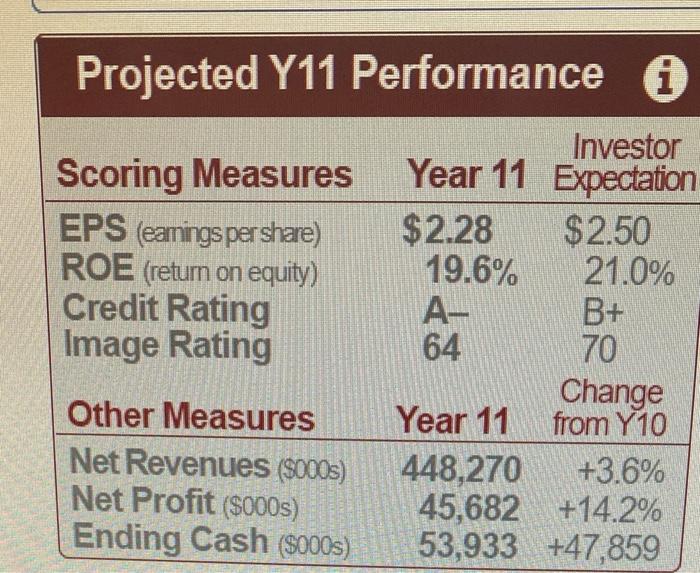
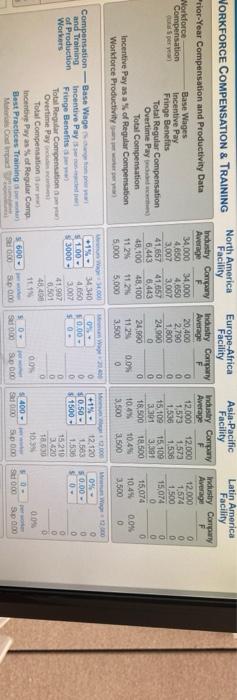
Projected Y11 Performance A Scoring Measures EPS (eanings pershare) ROE (return on equity) Credit Rating Image Rating Investor Year 11 Expectation $2.28 $2.50 19.6% 21.0% A- B+ 64 70 Change Year 11 from Y10 448,270 +3.6% 45,682 +14.2% 53,933 +47,859 Other Measures Net Revenues (5000s) Net Profit ($000s) Ending Cash ($000s) WORKFORCE COMPENSATION & TRAINING rior-Year Compensation and Productivity Data Workforce Base Wages Compensation Incentive Pay Serye Fringe Benefits Total Regular Compensation Overtime Pay ) Total Compensation Incentive Pay as a % of Regular Compensation Workforce Productivity North America Facility Industry Company Average F 34.000 34,000 4.650 4,850 3,007 3.007 41.657 41,657 6443 6443 18.100 48.100 112% 11.2014 5,000 5.000 Europe-Africa Facility Industry Company Average 20,400 0 2,790 0 1.800 0 24.900 0 Asia-Pacific Facility Industry Company Average 12.000 12,000 1,573 1.573 1.536 1.530 15.100 15.100 3.391 3,391 18.500 18500 10.4% 10.4% 3.500 3.500 Latin America Facility Industry Company Average F 12.000 O 1,574 0 1,500 15,074 0 15.074 0 10.4% 0.0% 3.500 0 Delov 24.900 1129 3.500 0 0.0% 0 0 10.00 - $0 0 0 0 +1% SO.50 - $ 1500 WWW.000 34340 S 100- 4050 $13000 31007 41.907 0.501 4. 111 5600 - Sond Compensation - Base Wage and Training Incentive Pay of Production Fringe Benefits Workers Total Regular Compensation Overtime Pays Total Compensation Incentive Pay as of Regular Comp Best Practices Training Cod mad 2000 12.120 150 1.538 15210 3.420 TO 10. W300 O 50.00 0 SEO 0 0 D 0 O 00 0 0% 400- 50 S000 50- Su 000 Sup000 S 5 000 Sp000 Projected Y11 Performance A Scoring Measures EPS (eanings pershare) ROE (return on equity) Credit Rating Image Rating Investor Year 11 Expectation $2.28 $2.50 19.6% 21.0% A- B+ 64 70 Change Year 11 from Y10 448,270 +3.6% 45,682 +14.2% 53,933 +47,859 Other Measures Net Revenues (5000s) Net Profit ($000s) Ending Cash ($000s) WORKFORCE COMPENSATION & TRAINING rior-Year Compensation and Productivity Data Workforce Base Wages Compensation Incentive Pay Serye Fringe Benefits Total Regular Compensation Overtime Pay ) Total Compensation Incentive Pay as a % of Regular Compensation Workforce Productivity North America Facility Industry Company Average F 34.000 34,000 4.650 4,850 3,007 3.007 41.657 41,657 6443 6443 18.100 48.100 112% 11.2014 5,000 5.000 Europe-Africa Facility Industry Company Average 20,400 0 2,790 0 1.800 0 24.900 0 Asia-Pacific Facility Industry Company Average 12.000 12,000 1,573 1.573 1.536 1.530 15.100 15.100 3.391 3,391 18.500 18500 10.4% 10.4% 3.500 3.500 Latin America Facility Industry Company Average F 12.000 O 1,574 0 1,500 15,074 0 15.074 0 10.4% 0.0% 3.500 0 Delov 24.900 1129 3.500 0 0.0% 0 0 10.00 - $0 0 0 0 +1% SO.50 - $ 1500 WWW.000 34340 S 100- 4050 $13000 31007 41.907 0.501 4. 111 5600 - Sond Compensation - Base Wage and Training Incentive Pay of Production Fringe Benefits Workers Total Regular Compensation Overtime Pays Total Compensation Incentive Pay as of Regular Comp Best Practices Training Cod mad 2000 12.120 150 1.538 15210 3.420 TO 10. W300 O 50.00 0 SEO 0 0 D 0 O 00 0 0% 400- 50 S000 50- Su 000 Sup000 S 5 000 Sp000


